Assessment & Diet Planning
Everything in the previous twelve chapters was about what nutrients do. This chapter is about how anyone actually finds out what a real person is eating — and what to do with that information. You will learn the four-part framework professionals use to size up nutritional status, why every method of measuring food intake is wrong in a predictable direction, how to read the two panels on a package that are legally required to tell you the truth, how to build a day of eating that genuinely meets the reference intakes, and how to tell a defensible nutrition claim from a confident-sounding one. Throughout, the posture is the same one the evidence supports: describe physiology, weigh evidence, and leave moralizing about food and bodies out of it.
By the end of this chapter you can
- Describe the ABCD framework of nutrition assessment and state what each domain can and cannot establish.
- Distinguish nutrition screening from nutrition assessment, and explain why no single measurement diagnoses nutritional status.
- Compare the 24-hour recall, the food record, and the food frequency questionnaire, and name the characteristic error of each.
- Explain why underreporting is systematic rather than dishonest, and how recovery biomarkers such as doubly labeled water revealed it.
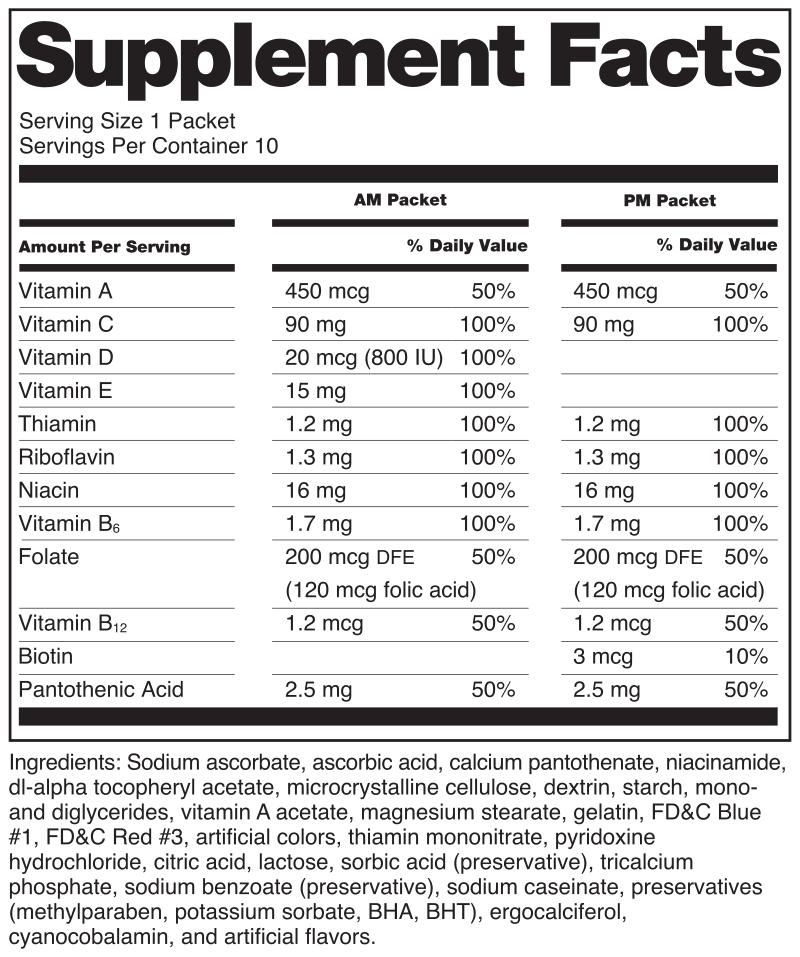
- Read a Nutrition Facts or Supplement Facts panel: serving size, %DV, the 5/20 heuristic, and the ingredient list.
- Use the DRI family — EAR, RDA, AI, UL, AMDR, EER — correctly when planning intake for one person versus a group.
- Build a day of eating that meets energy, macronutrient, fiber, and priority micronutrient targets, and state which values change with age, sex, or pregnancy.
- Evaluate a nutrition claim by study design, effect size, and conflict of interest, and recognize the recurring signatures of pseudoscience.
Section 1Nutrition assessment

Screening asks a question; assessment answers it
Two different activities get called "checking someone's nutrition." Nutrition screening is a fast, low-burden filter applied to everyone in a setting — a few questions about recent unintentional weight change, appetite, and ability to eat — designed to be sensitive rather than precise. Its only job is to flag who needs a closer look. Nutrition assessment is the closer look: a structured, multi-source evaluation that combines measurements, laboratory data, physical findings, and a detailed intake history into a picture no one of those sources could produce alone.
The reason assessment is deliberately multi-source is that every individual measure is ambiguous. A low body weight can reflect genetics, disease, or an ordinary healthy build. A low serum ferritin is fairly specific for depleted iron stores, but a normal or high one proves nothing when inflammation is present. A cracked mouth corner is consistent with several B-vitamin inadequacies and also with ill-fitting dentures. Convergence across domains is what turns a suggestive finding into a defensible conclusion.
The four domains: A, B, C, D
Anthropometric measures are physical dimensions of the body: height, weight, body mass index (weight in kilograms divided by height in meters squared), waist circumference, mid-upper-arm circumference, and skinfold thickness. In children, the meaningful anthropometric output is not a single number but a trajectory plotted on a growth reference — a child tracking steadily along a low percentile is a very different situation from a child who has crossed downward through two percentile channels. BMI deserves particular care: it was designed to describe populations, it does not distinguish muscle from fat, and its relationship to health outcomes varies by age, ancestry, and body composition. It is a screening input, not a diagnosis, and it says nothing about how a person eats.
Biochemical data are laboratory measures of nutrients, their metabolites, or their functional consequences. Serum 25-hydroxyvitamin D is the accepted marker of vitamin D status because it integrates both dietary and sun-derived supply. Serum ferritin reflects iron stores, hemoglobin falls only after those stores are exhausted, and soluble transferrin receptor helps separate iron deficiency from the anemia of inflammation. Serum vitamin B12 is an imperfect first pass; methylmalonic acid and homocysteine rise before B12 falls out of range and are the more sensitive functional markers. One important correction to older teaching: albumin and prealbumin are not nutrition markers. They fall with inflammation, injury, and illness regardless of intake, and current professional guidance treats them as markers of inflammatory burden rather than of protein status — a good example of strong evidence overturning a convenient shortcut.
Clinical assessment is the physical examination and history: skin, hair, nails, eyes, mouth, and muscle and fat stores, alongside the medical history and medications. Physical signs are late and frequently non-specific — by the time they appear, depletion has usually been prolonged, and most signs are compatible with several nutrient inadequacies and with non-nutritional causes. A handful are close to diagnostic in the right context, such as Bitot spots or perifollicular hemorrhage, but most earn their value only alongside the other three domains. Dietary assessment is the intake history, which in practice means far more than a food list. It includes meal patterns, cooking facilities, food security, budget, chewing and swallowing ability, gastrointestinal symptoms, allergies, medications that affect nutrient absorption, and cultural and religious food practices, all of which determine whether any plan built later is realistic.
| Domain | Typical measures | Answers well | Fails at |
|---|---|---|---|
| Anthropometric | Height, weight, BMI, waist circumference, MUAC, skinfolds, growth trajectory | Change over time; population-level screening | Body composition; any individual diagnosis from one number |
| Biochemical | Serum 25-hydroxyvitamin D, ferritin, hemoglobin, B12 with methylmalonic acid, urinary sodium | Objective nutrient status; subclinical depletion | Interpretation during inflammation; timing lag; cost |
| Clinical | Skin, hair, nails, eyes, oral exam, muscle and fat wasting, medical history, medications | Advanced deficiency; functional barriers to eating | Early or mild inadequacy; signs overlap across nutrients |
| Dietary | Recall, record, food frequency questionnaire, food security screen | What is actually eaten and why | Accuracy — every method carries systematic reporting error |
Physical signs worth recognizing
Classic deficiency syndromes are uncommon where the food supply is fortified and varied, but they are not extinct, and they cluster in predictable situations: restricted or highly repetitive diets, malabsorption, bariatric surgery, alcohol use disorder, and food insecurity. Recognizing them is a matter of pattern, not memorization for its own sake.
| Nutrient | Deficiency syndrome | Recognizable features |
|---|---|---|
| Vitamin C | Scurvy | Perifollicular hemorrhage, corkscrew hairs, bleeding swollen gums, poor wound healing |
| Vitamin A | Xerophthalmia | Night blindness first, then conjunctival dryness and Bitot spots; a leading preventable cause of childhood blindness worldwide |
| Thiamin (B1) | Beriberi; Wernicke encephalopathy | Peripheral neuropathy and high-output heart failure; or confusion, ataxia, and eye-movement abnormalities |
| Niacin (B3) | Pellagra | The classic triad: dermatitis in sun-exposed skin, diarrhea, dementia |
| Iron | Iron-deficiency anemia | Fatigue, pallor, spoon-shaped nails (koilonychia); ferritin falls before hemoglobin does |
| Iodine | Goiter; congenital hypothyroidism | Thyroid enlargement; irreversible neurodevelopmental harm when deficiency occurs in pregnancy |
| Vitamin D | Rickets (children); osteomalacia (adults) | Bowed legs and widened growth plates; bone pain and proximal weakness |
| Vitamin B12 | Megaloblastic anemia with neurologic injury | Numbness, gait change, cognitive change; the neurologic damage can become permanent |
- Screening is a sensitive filter for everyone; assessment is the detailed multi-source evaluation of those flagged.
- The four domains are Anthropometric, Biochemical, Clinical, Dietary — each is ambiguous alone and informative together.
- BMI is a population screening tool that cannot distinguish muscle from fat and cannot diagnose an individual.
- Albumin and prealbumin reflect inflammation, not protein intake — a widely taught claim that current evidence does not support.
- Physical deficiency signs appear late and are often non-specific; biochemical change usually precedes them.
Section 2Measuring intake

Three ways to ask, and what each is for
The 24-hour dietary recall is a structured interview covering everything consumed in the previous day. Done properly it follows a multiple-pass method: a quick uninterrupted list, then prompts for commonly forgotten items (condiments, drinks, snacks, additions to coffee), then time and occasion, then detailed portion and preparation questions, then a final review sweep. It has one enormous practical advantage — it is retrospective, so the person cannot change their behavior in response to being measured — and one enormous limitation: a single day is not a usual diet. Day-to-day variation within one person is large, especially for nutrients concentrated in a few foods, so estimating usual intake for an individual requires several nonconsecutive days including at least one weekend day.
The food record (food diary) is prospective: the person writes down foods as they eat them, usually for three to seven days, with weights or measured portions if the study demands precision. Records avoid memory error almost entirely. Their signature problem is reactivity — recording changes eating. People simplify meals, skip the snack they would rather not write down, or eat less because logging is effortful. Burden is high and adherence decays sharply after the first two or three days.
The food frequency questionnaire (FFQ) asks how often each of roughly 100 to 150 foods was eaten over a long window, typically the past month or year, sometimes with portion-size options. An FFQ is cheap, self-administered, and captures long-run patterns and episodically eaten foods that a few recall days would miss entirely. It is poor at absolute quantities — the food list is finite and portion assumptions are coarse — so its legitimate use is ranking people relative to one another in large studies, not stating that a given person consumed 1,840 mg of sodium. A brief screener is a short FFQ aimed at one target (fruit and vegetable servings, added sugars, calcium), useful for a rough read and nothing more.
| Method | Time frame | Best used for | Characteristic error |
|---|---|---|---|
| 24-hour recall | Previous day; repeat on several nonconsecutive days | Group mean intakes; usual intake with enough repeats | Memory lapses, portion misestimation, underreporting; one day is not usual intake |
| Food record | 3–7 consecutive days, prospective | Detailed, near-real-time intake; clinical follow-up | Reactivity — recording alters eating; high burden; adherence fades |
| Food frequency questionnaire | Past month to past year | Ranking individuals in large epidemiologic studies | Poor absolute accuracy; fixed food list; portion assumptions |
| Brief screener | Recent weeks | Fast targeted estimate of one dietary component | Very coarse; not valid for full nutrient analysis |
| Direct observation / weighed intake | Meal or day | Reference-quality data in controlled settings | Expensive, unrepresentative of free-living eating |
Every method errs in the same direction
Self-reported energy intake is systematically lower than measured energy expenditure. We know this with confidence because of doubly labeled water, a reference method in which a person drinks water labeled with stable isotopes of hydrogen and oxygen; the differential disappearance of the two isotopes over one to two weeks yields total energy expenditure with high accuracy. When self-reports are compared against it in weight-stable adults, reported energy commonly falls short by roughly ten to thirty percent, and the shortfall is not evenly distributed — it is larger in people with higher body weight, and larger for foods carrying social judgment. Parallel recovery biomarkers exist for individual nutrients: 24-hour urinary nitrogen for protein, and 24-hour urinary sodium and potassium for those minerals.
The important interpretation is that this is measurement error, not deceit. Its components are ordinary human cognition: forgetting items eaten while distracted, estimating portions poorly because almost nobody has practiced it, telescoping (misplacing a food into the wrong day), and the social pressure of describing your eating to a stranger holding a clipboard. Because the error is directional rather than random, it does not average out with a bigger sample — which is why nutritional epidemiology invests so heavily in calibration substudies and biomarkers.
From foods to nutrients
Reported foods become nutrient numbers by lookup in a food composition database, and that translation adds its own uncertainty. Composition varies with cultivar, soil, season, storage, and cooking method; a database entry is a representative average, not the sandwich in front of you. Some nutrients are especially unstable — folate and vitamin C degrade with heat and time — and mixed dishes must be broken into components or matched to a generic recipe. Digital tracking apps do not escape any of this; they often add a crowd-sourced database whose entries are unverified, so the apparent precision of "312 kcal" carries far more error than three digits imply.
- Recalls are retrospective and non-reactive; records are prospective and reactive; FFQs capture long-run patterns but rank rather than quantify.
- A single day cannot represent an individual's usual intake; multiple nonconsecutive days are required.
- Underreporting of energy is systematic, commonly on the order of 10–30 percent, and was established by comparison with doubly labeled water.
- Directional error does not shrink with sample size — only calibration and recovery biomarkers address it.
- Food composition databases add a second layer of uncertainty; reported nutrient totals are estimates, not measurements.
Section 3Reading a food label
Serving size is a reporting unit, not a recommendation
Every number on a Nutrition Facts panel is scaled to the serving size printed at the top, so that line governs the interpretation of everything below it. Serving sizes are not nutrition advice and never were. In the United States they derive from Reference Amounts Customarily Consumed — regulatory values based on survey data describing how much people actually eat at one sitting, which is why the 2016 label overhaul raised many of them and required that certain packages between 200 and 300 percent of a reference amount carry a dual-column panel showing both "per serving" and "per package." The practical habit is simple: before reading any other line, compare the stated serving with the amount you are realistically going to eat, and scale mentally.
The same overhaul made calories larger and bolder, added a mandatory Added Sugars line in grams with a %DV, replaced the required vitamin A and vitamin C declarations with vitamin D and potassium, and required actual quantities alongside %DV for the declared micronutrients. Calcium and iron remained required. Fiber, sugars, and protein grams are also given; %DV for protein is not required unless a protein claim is made, because protein adequacy is rarely the limiting issue in the populations the label serves.
%DV and the 5/20 heuristic
The Daily Value is a single set of reference numbers — deliberately one set, not a table by age and sex — chosen so one label works for the whole general population aged four and older. The %DV tells you what fraction of that reference a serving supplies, anchored to a 2,000-calorie reference diet. That anchoring is the main caveat: your own energy needs may sit well above or below 2,000 kcal, in which case the percentages for energy-scaled nutrients drift accordingly.
| Nutrient | Daily Value (adults and children 4+) | Reading note |
|---|---|---|
| Total fat | 78 g | Type matters more than total; the panel breaks out saturated and trans |
| Saturated fat | 20 g | Dietary Guidelines advise keeping it under 10 percent of calories |
| Sodium | 2,300 mg | Most sodium comes from packaged and restaurant food, not the shaker |
| Total carbohydrate | 275 g | Includes fiber, total sugars, and added sugars |
| Dietary fiber | 28 g | Most people fall far short of this |
| Added sugars | 50 g | Excludes sugars naturally present in fruit and dairy |
| Protein | 50 g | %DV optional unless a protein claim appears |
| Vitamin D | 20 mcg (800 IU) | Newly mandatory in the 2016 format |
| Calcium | 1,300 mg | Declared in milligrams as well as %DV |
| Iron | 18 mg | Pegged to the highest requirement (women 19–50), so %DV understates how much of the need a serving meets for men and for women 51+ (RDA 8 mg): 4 mg of iron reads 22% DV but supplies half of an 8 mg requirement |
| Potassium | 4,700 mg | Newly mandatory; a shortfall nutrient for most adults |
The 5/20 rule makes %DV usable at a glance: 5 percent DV or less per serving is low in that nutrient, and 20 percent DV or more is high. It works in both directions. You can use it to find foods high in the things most people under-consume — fiber, potassium, calcium, vitamin D — and to notice when a single serving carries a large share of the sodium or added-sugars reference. Regulated nutrient content claims follow the same arithmetic: "good source of" means 10–19 percent DV per serving, "excellent source" or "high in" means 20 percent DV or more, and "low sodium" means 140 mg or less per serving.
The ingredient list, allergens, and claims
Ingredients are listed in descending order by weight, which is the single most informative structural fact on the package: whatever appears first contributes the most mass. The list also exposes what the Nutrition Facts panel aggregates. Added sugars arrive under many names — sucrose, high-fructose corn syrup, cane juice, dextrose, maltose, honey, agave, fruit juice concentrate, malt syrup — and splitting sweeteners across several names moves each one further down the list even though their combined weight is large. Reading the two panels together defeats that: the Added Sugars gram line is unaffected by how the ingredient is named.
In the United States, the nine major allergens must be declared in plain language — milk, eggs, fish, crustacean shellfish, tree nuts, peanuts, wheat, soybeans, and sesame, the last added effective January 1, 2023. Beyond that, distinguish three tiers of claim. Nutrient content claims are arithmetic and verifiable. Health claims linking a food to a disease require prior authorization based on significant scientific agreement, and qualified health claims must disclose the weakness of their evidence. Structure/function claims — "supports immune health," "promotes healthy digestion" — require no premarket authorization. On a dietary supplement they must carry the disclaimer that the statement has not been evaluated by the Food and Drug Administration — a requirement of the Dietary Supplement Health and Education Act. On a conventional food such as a cereal or a beverage, no disclaimer is required, and you will usually not see one. That third tier is where most marketing language lives.
- Every panel number scales to the serving size, which reflects customary consumption rather than a recommendation.
- %DV is anchored to a 2,000-calorie reference diet; the 5/20 rule reads 5 percent DV as low and 20 percent DV as high.
- Current DVs include sodium 2,300 mg, fiber 28 g, added sugars 50 g, potassium 4,700 mg, and vitamin D 20 mcg.
- Ingredients run in descending order by weight; sweeteners can be split across names, so read the Added Sugars line too.
- Structure/function claims need no premarket authorization; the FDA disclaimer is required on supplements only, not on conventional foods.
Section 4Planning a diet
Know which reference value you are using
The Dietary Reference Intakes are a family of values, and using the wrong member is the most common planning error. The EAR (Estimated Average Requirement) is the intake meeting the needs of half of a healthy group — it is the correct tool for assessing or planning for groups, never for judging one person. The RDA is set roughly two standard deviations above the EAR so that it covers about 97–98 percent of healthy individuals in the life-stage group; it is the goal for an individual. The AI (Adequate Intake) is used where the data are too thin to compute an EAR, so it is an observation-based estimate rather than a requirement. The UL (Tolerable Upper Intake Level) is the highest chronic daily intake unlikely to cause harm — it is a ceiling, not a target, and it matters mainly for supplements and fortified foods. The AMDR gives macronutrient ranges as a share of energy, and the EER estimates energy needs from age, sex, weight, height, and physical activity.
Energy accounting rests on the metabolizable energy yields you have used all book: carbohydrate 4 kcal/g, protein 4 kcal/g, fat 9 kcal/g, alcohol 7 kcal/g. For adults, the AMDRs are 45–65 percent of energy from carbohydrate, 20–35 percent from fat, and 10–35 percent from protein; the fat range is deliberately higher in early life, at 30–40 percent for ages 1–3 years and 25–35 percent for ages 4–18 years, because young children need energy-dense food. The carbohydrate RDA is 130 g/day for adults and children aged 1 year and older, based on the brain's glucose use, rising to 175 g/day in pregnancy and 210 g/day in lactation. The protein RDA is 0.8 g/kg body weight per day for adults aged 19 and over, rising to about 1.1 g/kg/day during pregnancy and lactation; older adults and people recovering from illness or injury are frequently studied at higher intakes, and that literature is suggestive rather than settled. Fiber has an AI of 14 g per 1,000 kcal, which lands near 25 g/day for women and 38 g/day for men aged 19–50.
Anchor the priority micronutrients
You cannot hold every DRI in mind, and you do not need to. A small number of nutrients do most of the work in planning because requirements shift sharply across life stages or because population intakes commonly fall short. Note how many of these values are not one number but several.
| Nutrient | Reference intake by population | Why it drives planning |
|---|---|---|
| Iron | RDA 8 mg/day men 19+; 18 mg/day women 19–50; 8 mg/day women 51+; 27 mg/day in pregnancy. UL 45 mg/day adults | The largest sex- and life-stage swing of any mineral; heme iron is better absorbed, and vitamin C improves non-heme absorption |
| Calcium | RDA 1,300 mg/day ages 9–18; 1,000 mg/day adults 19–50; 1,200 mg/day women 51+ and all adults 71+ | Peak bone mass is built in adolescence; requirements rise again later in life |
| Vitamin D | RDA 15 mcg (600 IU)/day ages 1–70; 20 mcg (800 IU)/day age 71+. UL 100 mcg (4,000 IU)/day adults | Few foods contain it; fortified foods and sun exposure dominate supply |
| Folate | RDA 400 mcg DFE/day adults; 600 mcg DFE/day in pregnancy; 400 mcg/day of folic acid advised for anyone who could become pregnant | Neural tube closure happens before most pregnancies are recognized — the evidence here is strong |
| Vitamin B12 | RDA 2.4 mcg/day adults; adults over 50 are advised to get much of it from fortified foods or supplements | Food-bound B12 malabsorption rises with age; strict plant-based diets require a reliable source |
| Vitamin C | RDA 90 mg/day men, 75 mg/day women aged 19+; add 35 mg/day for people who smoke | One of the few RDAs adjusted for a behavior rather than a life stage |
| Vitamin A | RDA 900 mcg RAE/day men, 700 mcg RAE/day women. UL 3,000 mcg/day preformed retinol | Preformed retinol is teratogenic in excess; provitamin A carotenoids are not subject to the UL |
| Sodium | CDRR: reduce intake if above 2,300 mg/day for adults | Most intake is already in food before it reaches the table |
| Water | AI about 2.7 L/day total water for women, 3.7 L/day for men aged 19+, roughly 20 percent from food | Total water, not "eight glasses"; needs rise with heat, activity, and illness |
Build the day, then check it
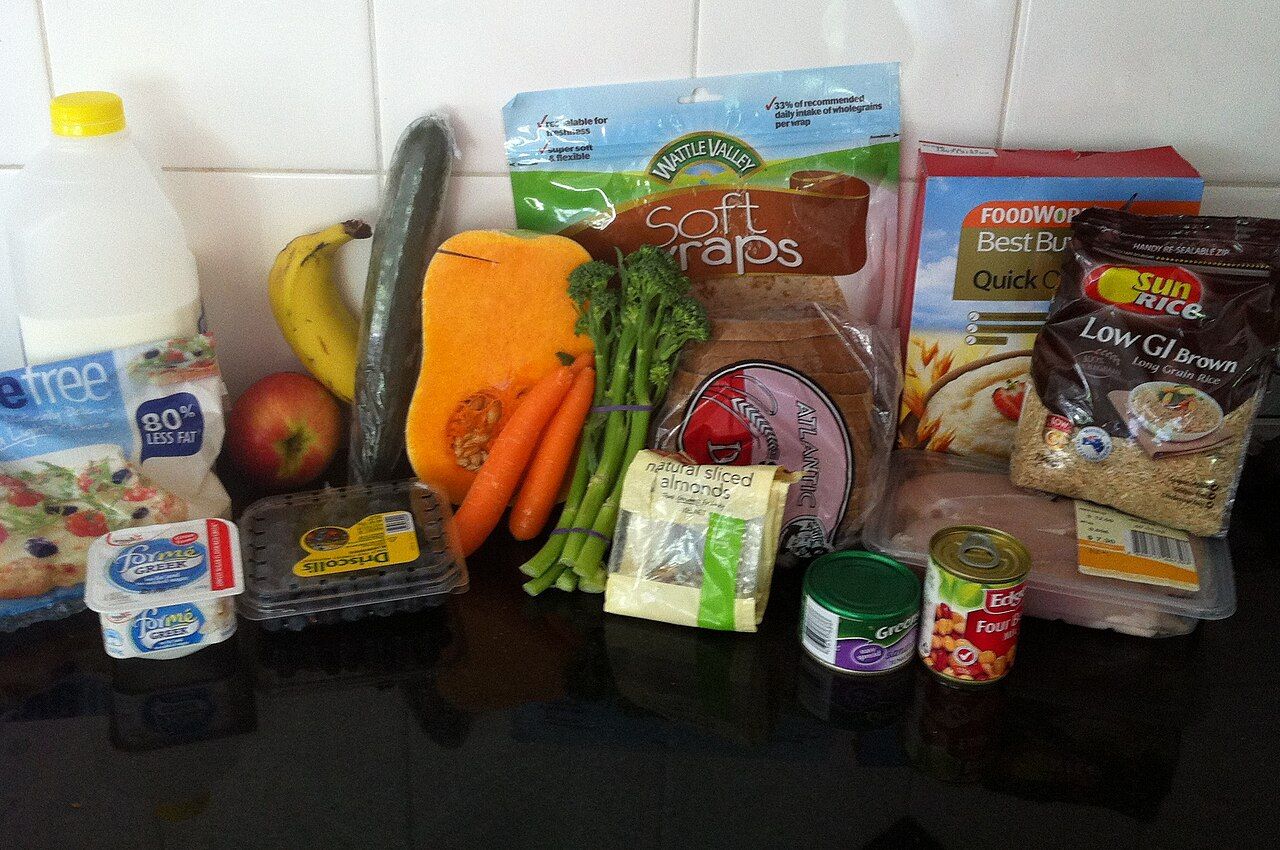
Planning works best as a two-pass process. The first pass builds a plausible day from food groups rather than from nutrients, because food groups are how nutrients actually travel: vegetables and fruit carry potassium, fiber, folate, vitamin C, and carotenoids; whole grains carry fiber, magnesium, and B vitamins, while enriched refined grains carry added iron and folic acid; legumes, fish, eggs, poultry, and meat carry protein, iron, and zinc, with B12 coming only from the animal-source members of that group or from fortified foods; dairy or fortified alternatives carry calcium, vitamin D, and potassium; nuts, seeds, and liquid plant oils carry unsaturated fat and vitamin E. Spreading protein across the day rather than concentrating it at dinner is a reasonable default, though the evidence that distribution matters much for healthy adults is preliminary.
The second pass checks the draft against the targets that most often fail. Run the energy arithmetic with the 4/4/9 yields and see whether the day plausibly meets estimated needs. Then check fiber, calcium, iron, vitamin D, and potassium specifically — these are the recurring shortfalls — and check the ceilings that matter for that person, usually sodium, added sugars, and any supplement approaching a UL. Finally, and most importantly, check feasibility: cost, cooking time, kitchen equipment, work schedule, cultural and religious practice, appetite, and preference. Adequacy is achieved over days and weeks, not at every meal, and a slightly imperfect plan someone will follow outperforms an optimal plan they abandon by Thursday.
| Planning step | What you are doing | Common mistake |
|---|---|---|
| 1. Set energy | Estimate EER from age, sex, size, activity | Treating an estimate as a precise prescription |
| 2. Distribute macronutrients | Apply AMDRs; convert percentages to grams with 4/4/9 | Forgetting the 130 g/day carbohydrate RDA floor |
| 3. Draft with food groups | Build meals and snacks that cover each group across the day | Planning nutrient by nutrient and producing food nobody eats |
| 4. Check shortfall nutrients | Fiber, calcium, iron, vitamin D, potassium | Assuming a varied-looking day automatically covers them |
| 5. Check ceilings | Sodium, added sugars, supplement ULs | Stacking a multivitamin with fortified foods past a UL |
| 6. Check feasibility | Cost, time, equipment, culture, preference, appetite | Skipping this step, which is why most plans fail |
- RDA is the target for an individual; EAR is for groups; AI is an estimate where data are thin; UL is a ceiling, not a goal.
- Energy yields are carbohydrate 4, protein 4, fat 9, alcohol 7 kcal per gram.
- Adult AMDRs: carbohydrate 45–65%, fat 20–35%, protein 10–35% of energy; the fat range is higher for young children.
- Key values shift with life stage — iron 18 mg/day for women 19–50 versus 8 mg/day for men, and 27 mg/day in pregnancy.
- Build with food groups, then verify shortfall nutrients, ceilings, and feasibility.
Section 5Evaluating nutrition information
Ask what kind of evidence this is
Nutrition claims are not all built from the same material, and the first useful question about any claim is what study design stands behind it. Mechanistic and cell-culture work explains how something could work but says nothing about whether it does in people. Animal studies add a living system but not a human one. Cross-sectional surveys describe correlation at a single moment. Case-control studies look backward and are vulnerable to recall bias. Prospective cohort studies follow people forward for years and are the workhorse of nutritional epidemiology — genuinely informative, but always shadowed by confounding, because people who eat any one thing differ systematically in dozens of other ways. Randomized controlled trials break that confounding by assigning the exposure, and systematic reviews and meta-analyses pool the whole body of trials.
Nutrition, though, imposes real limits on that ladder, and honest evaluation acknowledges them. You cannot blind people to broccoli. Outcomes like fracture or cardiovascular death take decades to appear. There is no true placebo diet, because eating more of one thing means eating less of another. Adherence to an assigned diet decays over months. Consequently much of the strongest nutrition evidence is a convergence across designs — consistent cohort findings, supportive trials on intermediate outcomes, and a plausible mechanism — rather than one decisive trial. Be equally wary of claims resting on mechanism alone and of demands that nothing count until a 20-year randomized trial exists.
Weigh the claim, not the confidence
Once you know the design, interrogate the numbers. Ask about effect size in absolute terms: "raises risk by 40 percent" is uninformative until you know whether the baseline risk is 1 in 2 or 1 in 100,000. Ask whether the outcome was a hard endpoint (heart attack, fracture, death) or a surrogate (a cholesterol value, a marker of inflammation) — surrogates move more easily and do not always carry the outcome with them. Ask about sample size and confidence intervals, about whether the finding is one result from many comparisons, and about who funded the work and who profits from the conclusion. Ask whether the dose studied is achievable through food, and whether the population studied resembles the one the claim is now being applied to.
Credentials help but do not settle anything. In many jurisdictions the title "nutritionist" is unregulated and can be used by anyone, while registered dietitian and registered dietitian nutritionist are protected credentials with defined coursework, supervised practice, and a national examination. A clinician or researcher speaking outside their field carries no special authority there, and expertise never substitutes for the evidence itself.
| Red flag | Why it signals trouble | Better question to ask |
|---|---|---|
| "Detoxes" or "cleanses" the body | Named toxin is almost never specified; the liver and kidneys already do this continuously | Which substance, measured how, cleared by what mechanism? |
| One food or nutrient fixes many unrelated conditions | Real interventions have narrow, mechanism-bounded effects | What is the single primary outcome, in one defined population? |
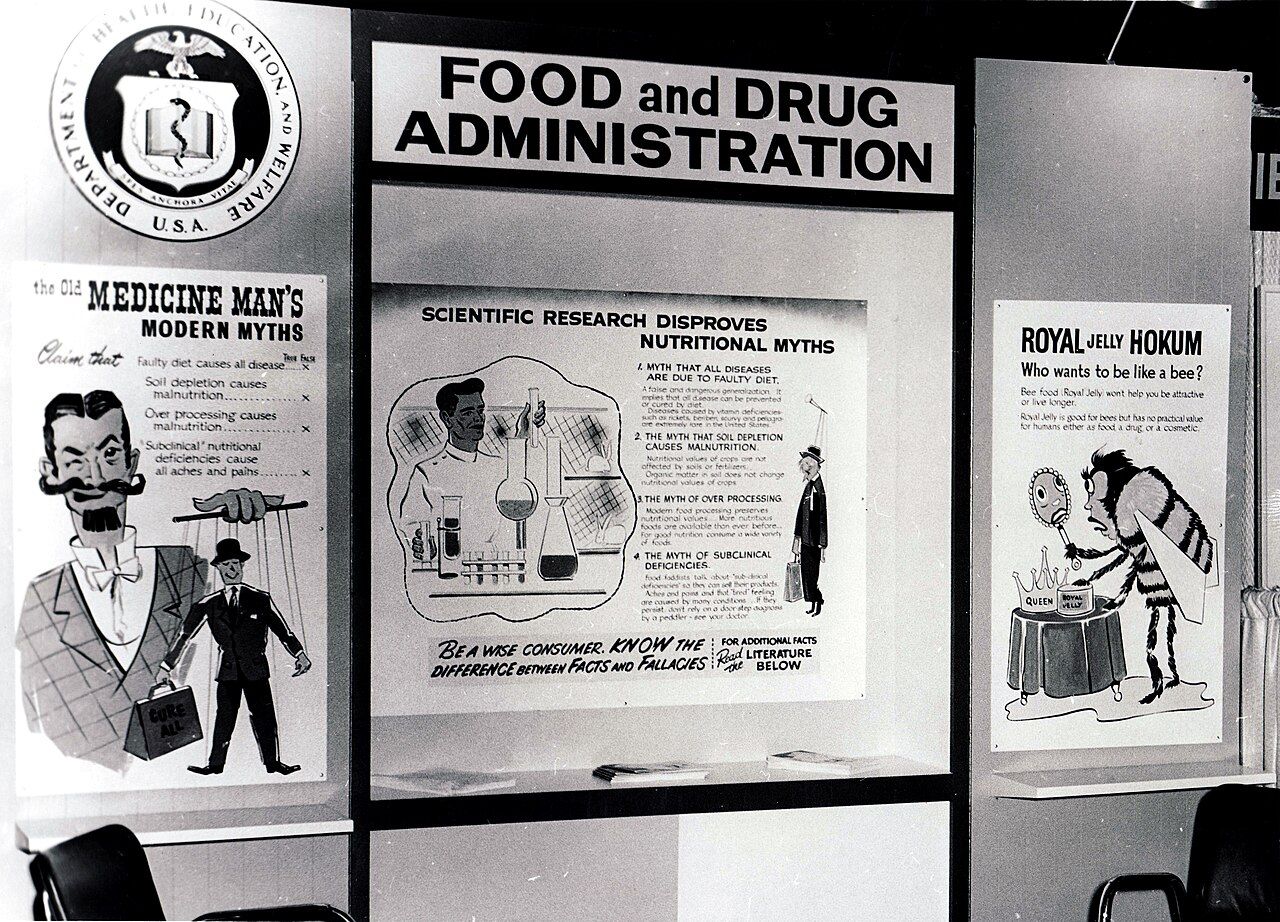
| "Clinically proven" with no citation | The phrase is unregulated marketing language | Which study — design, size, journal, who funded it? |
| Testimonials and dramatic before/after stories | Selected anecdotes cannot show effect; regression to the mean and placebo response are unmeasured | What happened to the people who did not improve? |
| "Natural," "ancient," or "chemical-free" | Origin says nothing about safety or efficacy; every food is chemicals | What does the evidence show about this preparation, at this dose? |
| Proprietary blend, undisclosed amounts | Prevents any comparison with a studied dose or with a UL | How many milligrams of each ingredient per serving? |
| The person making the claim sells the product | A direct financial conflict of interest | Does independent evidence exist from people who do not profit? |
| "Doctors don't want you to know" | Conspiracy framing pre-empts scrutiny instead of answering it | What would it take to change your mind? |
| Foods sorted into "clean" and "toxic" | Moral framing of food is not a physiologic category, and it is associated with disordered eating patterns rather than with better health | What does this pattern of eating do, measured how? |
Why single-nutrient extrapolation goes wrong
A recurring failure mode deserves its own attention, because it looks like good reasoning. The chain runs: people who eat more of food X have less of disease Y; food X is rich in nutrient N; therefore supplement N to prevent Y. Each link is plausible, and the conclusion has repeatedly failed when tested. The clearest example is beta-carotene. Observational data consistently associated carotenoid-rich diets with lower lung cancer rates, but two large randomized trials of high-dose beta-carotene supplements in smokers and asbestos-exposed workers found more lung cancer in the supplemented groups, and one was stopped early. Similar reversals followed trials of high-dose vitamin E for cardiovascular prevention. The lesson is not that food does not matter — it is that a nutrient extracted from its food matrix, given at a dose no diet delivers, is a different intervention from the diet that generated the hypothesis.
The practical stance that follows is calibrated rather than cynical. Some nutrition conclusions rest on strong, convergent evidence: folic acid before and during early pregnancy reduces neural tube defects; iodine sufficiency in pregnancy protects neurodevelopment; vitamin D prevents rickets; replacing saturated with unsaturated fat lowers LDL cholesterol. Others are genuinely preliminary, including much of the work on the microbiome, on precise meal timing, and on personalized nutrition by genotype. Saying clearly which tier a claim occupies is the whole skill — and remember that general education of this kind is not individualized medical or dietary advice, which belongs with a qualified clinician who knows the person's full situation.
- Evidence runs from mechanism and animal work through cohorts to randomized trials and systematic reviews; nutrition constrains that ladder in real ways.
- Judge absolute effect size, hard versus surrogate endpoints, confidence intervals, and funding — not the confidence of the speaker.
- Recurring red flags: unspecified detox, cure-alls, uncited "clinically proven," testimonials, proprietary blends, and moralized food categories.
- Single-nutrient extrapolation from dietary patterns has failed in randomized trials — high-dose beta-carotene increased lung cancer in smokers.
- Distinguish strong conclusions (folic acid and neural tube defects) from preliminary ones (microbiome, meal timing, genotype-based personalization).
The chapter in one breath
- Nutrition assessment triangulates four domains — anthropometric, biochemical, clinical, dietary — because no single measure is interpretable alone.
- BMI screens populations and cannot diagnose an individual; albumin and prealbumin track inflammation, not protein intake.
- Recalls, records, and FFQs answer different questions and fail differently: memory, reactivity, and coarse quantification respectively.
- Energy underreporting is systematic — roughly 10–30 percent against doubly labeled water — and is measurement error, not dishonesty.
- On a label, serving size governs every number, %DV assumes 2,000 kcal, the 5/20 rule reads low versus high, and ingredients run by descending weight.
- Plan with the right DRI: RDA for an individual, EAR for a group, AI where data are thin, UL as a ceiling, AMDR for macronutrient ranges.
- Energy yields are 4/4/9/7 kcal per gram for carbohydrate, protein, fat, and alcohol; requirements for iron, calcium, vitamin D, and folate shift with age, sex, and pregnancy.
- Evaluate claims by design, absolute effect size, endpoint, and conflict of interest, and keep strong evidence clearly separated from preliminary evidence.
ReferenceWords worth knowing
A working vocabulary for assessment and planning — skim it now, and return whenever a reference value or study term needs pinning down.
- Acceptable Macronutrient Distribution Range (AMDR)
- The range of energy intake from each macronutrient associated with reduced chronic disease risk while supplying essential nutrients; for adults, carbohydrate 45–65%, fat 20–35%, protein 10–35% of total energy.
- Adequate Intake (AI)
- A DRI used when evidence is insufficient to set an EAR and RDA; based on observed or experimentally determined intakes of apparently healthy people.
- Anthropometric measurement
- Physical measurement of the body — height, weight, BMI, circumferences, skinfolds — used chiefly to track change over time.
- Biochemical assessment
- Laboratory measurement of nutrients, their metabolites, or functional markers, such as serum 25-hydroxyvitamin D, ferritin, or methylmalonic acid.
- Body mass index (BMI)
- Weight in kilograms divided by height in meters squared; a population screening index that does not distinguish muscle from fat and does not diagnose an individual.
- Daily Value (DV)
- The single set of label reference amounts, anchored to a 2,000-calorie reference diet, used to compute %DV for people aged four and older.
- Dietary Reference Intakes (DRIs)
- The umbrella family of reference values — EAR, RDA, AI, UL, AMDR, EER, CDRR — for planning and assessing intakes of healthy people.
- Doubly labeled water
- A reference method using stable isotopes of hydrogen and oxygen to measure total energy expenditure; the standard against which self-reported energy intake is validated.
- Estimated Average Requirement (EAR)
- The intake meeting the requirement of half the healthy individuals in a life-stage and sex group; used for groups, not for judging one person.
- Estimated Energy Requirement (EER)
- Predicted energy intake needed to maintain energy balance, computed from age, sex, weight, height, and physical activity level.
- Food frequency questionnaire (FFQ)
- A checklist of how often specified foods were eaten over months to a year; good for ranking people in large studies, poor for absolute quantities.
- Food record
- A prospective log of foods and amounts as they are eaten, typically 3–7 days; avoids memory error but is prone to reactivity and declining adherence.
- Ingredient list
- The package listing of ingredients in descending order by weight, including required plain-language declaration of major allergens.
- Nutrient content claim
- A regulated package statement about a nutrient's level, such as "good source" (10–19% DV per serving) or "high in" (20% DV or more per serving).
- Nutrition screening
- A brief, sensitive first-pass tool applied broadly to identify who needs a full nutrition assessment.
- Randomized controlled trial (RCT)
- A study assigning participants to interventions by chance, breaking confounding; in nutrition, limited by blinding, adherence, and long outcome latency.
- Recommended Dietary Allowance (RDA)
- The intake sufficient to meet the needs of about 97–98 percent of healthy individuals in a life-stage and sex group; the planning goal for an individual.
- Reference Amount Customarily Consumed (RACC)
- The survey-derived amount of a food typically eaten at one occasion, used to set regulated label serving sizes.
- Systematic review
- A structured synthesis of all studies meeting prespecified criteria, sometimes combined statistically as a meta-analysis.
- Tolerable Upper Intake Level (UL)
- The highest chronic daily intake likely to pose no risk of adverse effects; a ceiling to stay under, never a target to reach.
- Twenty-four-hour dietary recall
- A structured multiple-pass interview about everything consumed in the previous day; non-reactive, but a single day cannot represent usual intake.
- Underreporting
- The systematic tendency of self-reported intake to fall below measured intake, driven by memory, portion misestimation, and social desirability rather than deceit.