Energy Balance & Weight
Every day your body runs an account. Food and drink deposit energy; breathing, thinking, digesting, fidgeting, and moving withdraw it. Over years, the running balance of that account shows up as body weight — but the ledger is nothing like a bank statement, because the two sides talk to each other constantly, and the body actively defends the balance it has settled on. This chapter walks through where food energy comes from, where it goes, how body composition is measured and mismeasured, why hunger and satiety are hormonally orchestrated rather than willed, and what the evidence actually shows about managing weight. Along the way, one rule holds: physiology is described, never moralized. No food is a sin, and no body is a verdict.
By the end of this chapter you can
- State the energy yield of carbohydrate, protein, fat, and alcohol and use it to estimate the energy in a food.
- Define energy balance and explain why the two sides of the equation are not independent.
- Break total energy expenditure into basal metabolism, the thermic effect of food, and activity, and rank them by size and by variability.
- Calculate and interpret BMI and waist circumference, and name at least four situations in which BMI misleads.
- Distinguish body weight from body composition and compare the common assessment methods.
- Describe how leptin, ghrelin, and gut satiety peptides signal to the hypothalamus, and explain why the body defends weight loss more strongly than weight gain.
- Summarize the behaviors with the strongest evidence for weight management, and distinguish them from preliminary or single-study claims.
- Explain the physiological and behavioral reasons fad diets reliably fail, without blaming the person following them.
Section 1Energy balance — intake versus expenditure

What a calorie actually is
A calorie in nutrition is really a kilocalorie (kcal) — the energy needed to raise one kilogram of water by one degree Celsius. When a food label in the United States says "Calories 230," it means 230 kilocalories. Much of the world uses kilojoules instead; the conversion is fixed: 1 kcal = 4.184 kJ. So a 230 kcal snack is about 962 kJ, and the same food is described two different ways on two different labels without any disagreement about the physics.
Only four things in the diet supply energy, and their yields are worth memorizing cold, because nearly every calculation in this chapter rests on them. These are the Atwater factors — average physiological fuel values, already discounted for the fraction of each nutrient the body fails to digest or absorb.
| Energy source | Yield | In kilojoules | Notes |
|---|---|---|---|
| Carbohydrate | 4 kcal/g | 17 kJ/g | Includes sugars and starch; the body's default fuel |
| Protein | 4 kcal/g | 17 kJ/g | Usable for energy, but that is not its primary job |
| Fat | 9 kcal/g | 37 kJ/g | Most energy-dense — more than twice carbohydrate or protein |
| Alcohol | 7 kcal/g | 29 kJ/g | Supplies energy but essentially no nutrients |
| Dietary fiber | ~2 kcal/g | ~8 kJ/g | Partly fermented by colonic bacteria into absorbable short-chain fatty acids |
| Water, vitamins, minerals | 0 | 0 | Essential, but they yield no energy themselves |
Put those numbers to work. A food with 20 g carbohydrate, 5 g protein, and 10 g fat supplies (20 × 4) + (5 × 4) + (10 × 9) = 80 + 20 + 90 = 190 kcal, and 47 percent of that energy comes from fat. This is exactly the arithmetic behind every "percent of calories from…" statement you will ever read.
The balance equation, and why it is not a bank account
Energy balance is the relationship between energy consumed and energy expended over time. Three states are possible. In energy equilibrium, intake equals expenditure and body energy stores are stable. In positive energy balance, intake exceeds expenditure and the surplus is stored — a small amount as glycogen with its accompanying water, the rest as triglyceride in adipose tissue, and, when training or growth demands it, some as lean tissue. In negative energy balance, expenditure exceeds intake and the body mobilizes stored fuel, along with some lean tissue.
The first law of thermodynamics genuinely applies here: energy is not created or destroyed inside a person. But the equation is a poor predictive model, because intake and expenditure are not independent variables. Eat less and resting metabolism falls, spontaneous movement drops, and hunger rises. Eat more and the thermic cost of processing that food rises, fidgeting increases, and satiety signals push back. The body behaves like a thermostat with an opinion, not like a spreadsheet.
The old rule of thumb that a 3,500 kcal deficit removes one pound of fat comes from the energy content of adipose tissue, and as a one-week estimate it is roughly fine. Extended over months it is demonstrably wrong, and predictably so: it assumes expenditure never adapts. Dynamic models — the kind behind the NIH Body Weight Planner — account for the falling expenditure that accompanies a smaller body and consistently match real trials better. The static rule overpredicts long-term loss by a wide margin, and telling someone otherwise sets them up to feel like a failure at physics they never violated.
| State | Relationship | What happens to stores | Typical context |
|---|---|---|---|
| Equilibrium | Intake = expenditure | Stable | Weight-stable adult |
| Positive balance | Intake > expenditure | Energy stored | Growth, pregnancy, recovery, muscle gain, weight gain |
| Negative balance | Intake < expenditure | Energy mobilized | Weight loss, acute illness, prolonged undereating |
Note that positive balance is not a problem to be solved — it is required during childhood growth, pregnancy, lactation, wound healing, and recovery from illness. The Dietary Reference Intakes reflect this: pregnancy adds roughly 340 kcal/day in the second trimester and about 452 kcal/day in the third above pre-pregnancy needs, and lactation adds roughly 330 kcal/day above pre-pregnancy needs in the first six months and about 400 kcal/day in the second six months. Context decides whether a given balance state is healthy.
- Energy yields: carbohydrate 4, protein 4, fat 9, alcohol 7 kcal/g; fiber about 2; water, vitamins, and minerals supply none. 1 kcal = 4.184 kJ.
- Energy balance is intake versus expenditure over time; positive, negative, and equilibrium states all have legitimate contexts.
- The two sides of the equation influence each other, which is why simple arithmetic underpredicts how hard long-term change is.
- Energy has an EER, not an RDA, because an allowance with a safety margin would overfeed nearly everyone.
Section 2Components of energy expenditure
The three components
Total energy expenditure (TEE) is the sum of three parts, plus a small fourth in specific conditions. Learning their relative sizes tells you where the leverage is — and, just as importantly, where it is not.
| Component | Share of TEE | What it is | How changeable |
|---|---|---|---|
| Basal / resting metabolism | ~60–75% | Keeping cells alive at rest: ion pumps, protein turnover, heart, brain, liver, kidney | Largely fixed; driven by body size and composition |
| Thermic effect of food | ~10% | Digesting, absorbing, transporting, and storing nutrients | Small and mostly proportional to intake |
| Physical activity | ~15–30% (up to 50%+ in athletes) | Deliberate exercise plus all other movement | Most variable component, by far |
| Adaptive thermogenesis | Small, variable | Heat production responding to cold, overfeeding, or underfeeding | Involuntary; poorly captured by prediction equations |
Basal metabolism — the largest and least dramatic piece
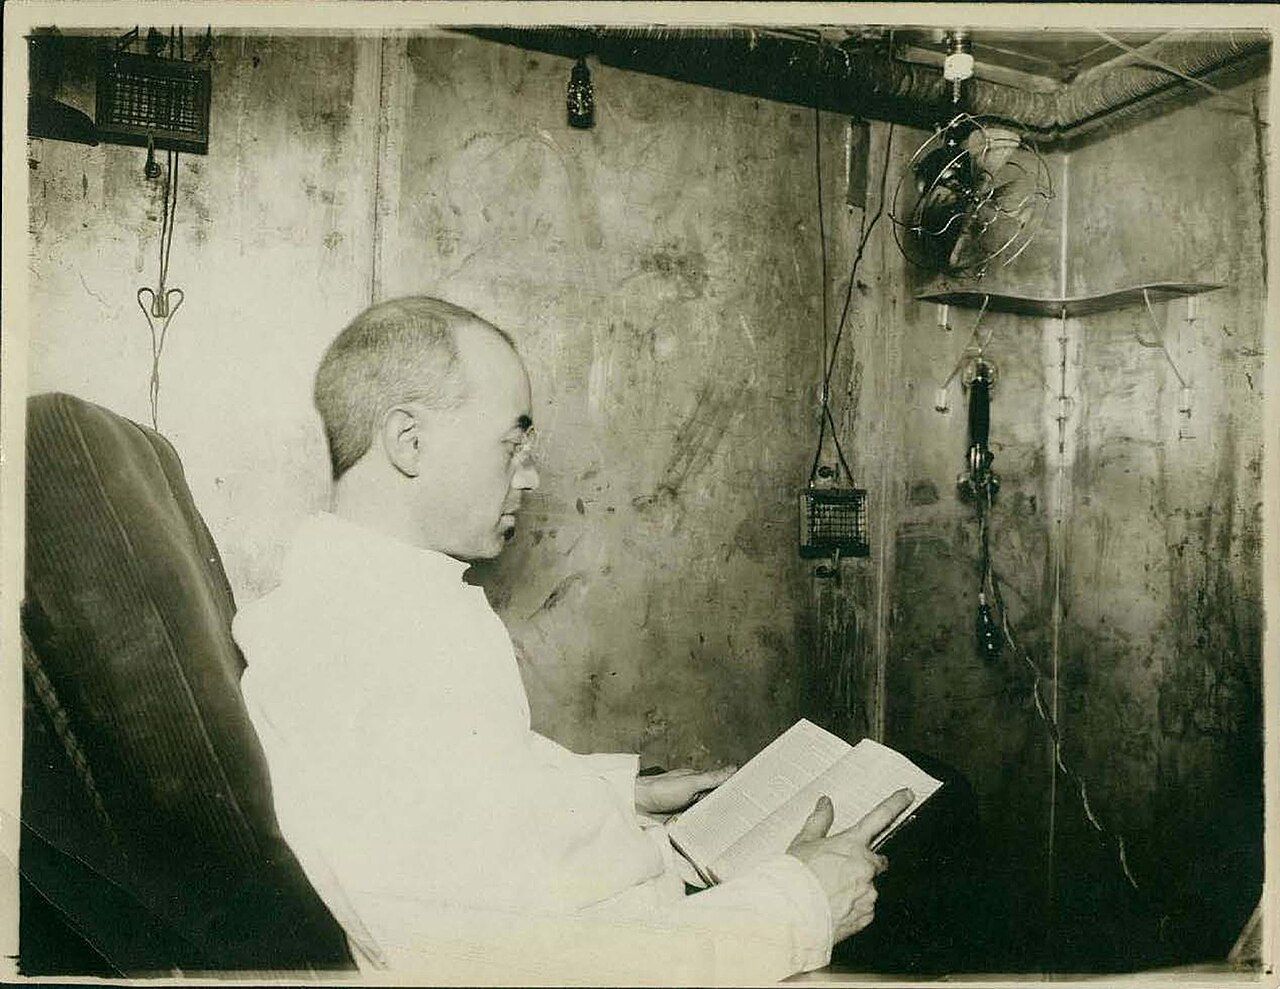
Basal metabolic rate (BMR) is the energy cost of staying alive at complete rest, measured under strict conditions: after a 12-hour fast, lying down, awake, in a thermoneutral room, undisturbed. Because those conditions are hard to arrange, laboratories usually report resting metabolic rate (RMR), measured under slightly relaxed conditions, which runs roughly 5–10 percent higher. The two terms are often used interchangeably in practice; the numbers are close enough that the distinction rarely changes a conclusion.
What actually determines BMR? Fat-free mass is the dominant predictor, explaining most of the between-person variation. Organs are metabolically expensive per gram — liver, brain, heart, and kidney together account for roughly 60–70 percent of resting expenditure while making up only about 5–6 percent of body weight. Resting skeletal muscle, by contrast, is surprisingly cheap per kilogram, which is why the popular claim that adding a pound of muscle burns hundreds of extra calories a day is a large exaggeration; realistic estimates are on the order of 6 kcal per pound per day at rest (about 13 kcal per kilogram). Muscle is worth building for many excellent reasons — strength, function, glucose handling, bone loading, independence with age — but a dramatic metabolic bonus is not one of them.
Other influences: males typically have higher BMR than females of the same weight, mostly because they carry more fat-free mass. Thyroid hormone, fever (roughly a 13 percent rise per degree Celsius, or about 7 percent per degree Fahrenheit), pregnancy, growth, healing, and some medications all shift it. Regarding age, a large pooled analysis of doubly labeled water data across the lifespan reported that size-adjusted total expenditure peaks in infancy at roughly 50 percent above adult levels, stays remarkably stable from about age 20 to 60, and then declines slowly — on the order of 0.7 percent per year. That finding, based on thousands of measurements, has reframed the old story of metabolism "crashing" in your thirties, though it is one analysis of pooled observational data and deserves the usual caution.
The thermic effect of food, and the enormous variability of activity
The thermic effect of food (TEF) — also called diet-induced thermogenesis — is the energy spent processing what you eat. On a mixed diet it runs about 10 percent of energy intake, and it differs by macronutrient: protein is the most expensive at roughly 20–30 percent of its own energy, carbohydrate about 5–10 percent, and fat only about 0–3 percent because dietary fat is stored with minimal chemical rearrangement. This is a real reason higher-protein meals feel more "costly," but the absolute numbers are modest — a 100 kcal protein serving nets you perhaps 20–30 kcal of processing cost, not a free pass.
Activity is the component that actually swings. It splits into exercise activity thermogenesis — deliberate, structured movement — and non-exercise activity thermogenesis (NEAT), which covers everything else: walking to the bus, standing, cooking, pacing, fidgeting, occupational movement. NEAT differences between two similarly sized adults can reach hundreds of kilocalories per day, and studies of deliberate overfeeding found that people who spontaneously increased NEAT the most gained the least fat. Crucially, NEAT is largely involuntary and it falls during energy restriction, which is one of several reasons that measured weight loss lags the arithmetic prediction.
| Method | What it measures | Strengths | Limits |
|---|---|---|---|
| Direct calorimetry | Heat released in a sealed chamber | Reference standard for heat production | Expensive; unnatural setting |
| Indirect calorimetry | O₂ consumed and CO₂ produced | Practical clinical RMR measurement | Requires standardized conditions |
| Doubly labeled water | Free-living TEE over 1–2 weeks | Gold standard for real-world expenditure | Costly; gives a total, not components |
| Prediction equations | Estimated RMR from size, age, sex | Free and instant (e.g., Mifflin–St Jeor) | Typically ±10% or worse for an individual |
| Wearables / trackers | Estimated activity energy | Useful for tracking trends | Individual calorie estimates are often substantially off |
To convert RMR into TEE, multiply by a physical activity level (PAL) factor: roughly 1.0–1.39 for sedentary, 1.4–1.59 for low active, 1.6–1.89 for active, and 1.9–2.5 for very active. Treat the result as a starting hypothesis to be revised against real-world observation, not a fact.
- TEE = basal metabolism (~60–75%) + thermic effect of food (~10%) + activity (~15–30%), plus adaptive thermogenesis.
- Fat-free mass is the strongest predictor of BMR; high-turnover organs, not resting muscle, dominate resting energy use.
- TEF is about 10% of intake overall — roughly 20–30% for protein, 5–10% for carbohydrate, 0–3% for fat.
- NEAT is the most variable and most underestimated piece, and it falls during energy restriction.
Section 3Body composition and assessment

Weight is a number; composition is the question
Body weight lumps together things with completely different meanings: skeletal muscle, bone, organs, body water, glycogen and its bound water, gut contents, and adipose tissue. Body composition separates them, most simply into fat mass and fat-free mass. This distinction matters because health outcomes track composition and fat distribution far better than they track total weight.
Some body fat is not optional. Essential fat — in cell membranes, nerve sheaths, bone marrow, and reproductive tissue — is roughly 3–5 percent of body mass in men and 8–12 percent in women, the higher female value reflecting sex-specific reproductive tissue. Sustained levels below that range are associated with impaired hormone production, menstrual disruption, reduced bone density, impaired immune function, and poor thermoregulation. Typical healthy ranges are often quoted as roughly 10–20 percent for men and 18–28 percent for women, rising modestly with age, but these ranges are approximate, source-dependent, and not diagnostic thresholds.
BMI: useful population tool, blunt individual instrument
Body mass index is weight in kilograms divided by height in meters squared: BMI = kg ÷ m². In pounds and inches, BMI = (lb ÷ in²) × 703. A person who is 70 kg and 1.75 m has a BMI of 70 ÷ (1.75)² = 70 ÷ 3.06 = 22.9 kg/m².
| Adult category (WHO) | BMI (kg/m²) | Asian-population cut points (WHO) | Comment |
|---|---|---|---|
| Underweight | < 18.5 | < 18.5 | Warrants evaluation for cause, not assumption |
| Healthy range | 18.5–24.9 | 18.5–22.9 | Statistical range, not a personal ideal |
| Overweight | 25.0–29.9 | 23.0–27.4 | Risk category, not a diagnosis |
| Obesity, class I | 30.0–34.9 | ≥ 27.5 | Lower thresholds reflect higher risk at lower BMI |
| Obesity, class II | 35.0–39.9 | — | — |
| Obesity, class III | ≥ 40.0 | — | — |
Children and adolescents aged 2–19 are not classified with adult cut points. BMI is plotted as BMI-for-age percentiles on growth charts: below the 5th percentile is underweight, 5th to below 85th is the healthy range, 85th to below 95th is overweight, and at or above the 95th percentile is obesity. The same BMI number means entirely different things at age 6, age 16, and age 46.
Now the limitations, which are substantial. BMI does not measure fat at all — it measures mass relative to height. It cannot distinguish muscle from adipose tissue, so a muscular athlete may be classified as "overweight" while carrying very little fat. It says nothing about where fat sits, which is arguably the more important variable. It performs differently across ancestry groups, which is precisely why the WHO publishes lower cut points for many Asian populations, where cardiometabolic risk rises at lower BMI values. It misleads in older adults, who lose lean mass and height. It is not valid in pregnancy. And it was never designed for individuals in the first place: it descends from nineteenth-century work by Adolphe Quetelet describing populations, not diagnosing patients.
Fat distribution, and better questions than "what do you weigh?"
Where fat is stored carries independent risk information. Visceral adipose tissue, packed around the abdominal organs, is metabolically active and associated with insulin resistance, dyslipidemia, hypertension, and cardiovascular disease more strongly than subcutaneous fat on the hips and thighs. Ectopic fat — fat deposited in the liver, skeletal muscle, or pancreas — carries risk that total weight does not reveal.
Waist circumference is the cheapest way to get at this. Measure with a flexible tape at the level of the top of the iliac crest, snug but not compressing, at the end of a normal exhalation. Commonly used risk thresholds in adults of European descent are greater than 102 cm (40 in) for men and greater than 88 cm (35 in) for women; lower thresholds — often around 90 cm for men and 80 cm for women — are recommended for South Asian, Chinese, and several other populations. Waist-to-height ratio is a simple alternative with growing support: keeping waist below half of height (ratio under 0.5) is an easy rule that performs at least as well as BMI for cardiometabolic risk in many datasets, though it is not yet universally adopted.
| Method | What it estimates | Accuracy | Practical notes |
|---|---|---|---|
| BMI | Weight relative to height | Population screening only | Free; misclassifies muscular, older, and pregnant people |
| Waist circumference | Central adiposity | Good risk indicator | Needs consistent landmark and technique |
| Skinfold calipers | Subcutaneous fat | Highly technique-dependent | Cheap; needs a trained, consistent measurer |
| Bioelectrical impedance (BIA) | Fat-free mass via conductivity | Moderate; sensitive to hydration | Common in scales; standardize timing and fluid status |
| Air displacement (Bod Pod) | Body density → fat percent | Good | Laboratory equipment |
| DXA | Fat, lean, and bone by region | Very good; a common reference | Small radiation dose; not for routine screening |
| MRI / CT | Visceral versus subcutaneous fat | Reference standard | Expensive; mostly research |
- BMI = kg/m²; adult ranges are <18.5, 18.5–24.9, 25.0–29.9, and ≥30, with lower cut points recommended for many Asian populations.
- Children and teens use BMI-for-age percentiles (5th, 85th, 95th), never adult categories.
- BMI measures neither fat nor its location; it misleads in athletes, older adults, pregnancy, and across ancestry groups.
- Waist circumference and waist-to-height ratio capture central adiposity, which carries risk information BMI misses.
Section 4Regulation of body weight
Hunger, appetite, satiation, satiety
Four words that everyday speech blurs together mean four different things. Hunger is the physiological drive to eat, generated largely by signals from the gut, adipose tissue, and hypothalamus. Appetite is the psychological desire to eat, shaped by sight, smell, memory, habit, emotion, social setting, and availability — which is why you can be full and still want dessert. Satiation is the process that brings a meal to an end. Satiety is the feeling of fullness that persists afterward and determines how long until the next meal. A food can be highly satiating but poorly satisfying, or the reverse; both matter.
The hormonal control loop
The hypothalamus, particularly the arcuate nucleus, integrates the signals. Two opposing neuron populations sit there: NPY/AgRP neurons drive eating, and POMC/CART neurons suppress it, acting through what is called the melanocortin pathway and its MC4R receptor. Mutations in MC4R are the most common single-gene cause of severe obesity, though they still explain only a small percentage of cases.
| Signal | Source | Effect on eating | Timescale |
|---|---|---|---|
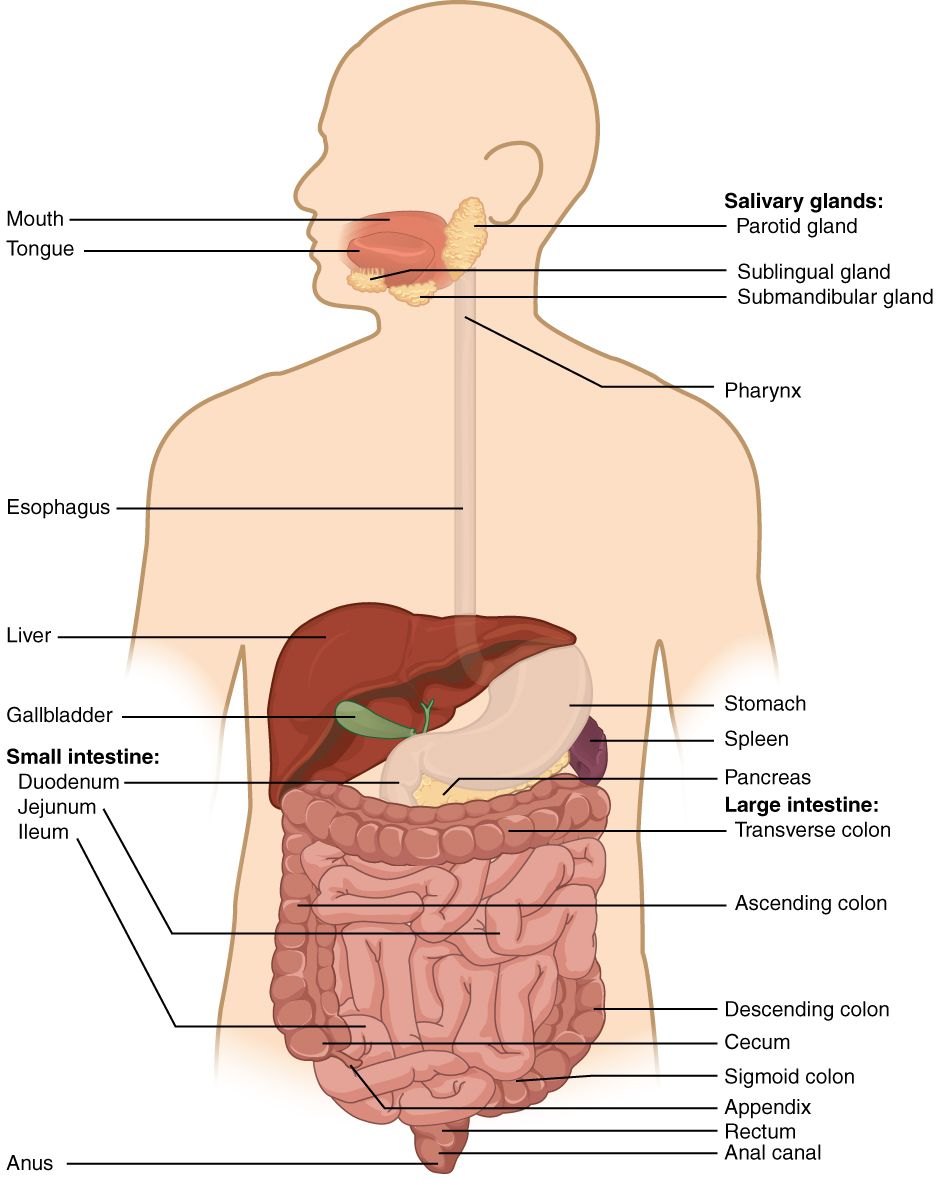
| Ghrelin | Stomach | Increases hunger; rises before meals, falls after | Meal to meal |
| Cholecystokinin (CCK) | Duodenum | Promotes satiation; slows gastric emptying | Within a meal |
| GLP-1 | Intestinal L cells | Promotes satiety; slows gastric emptying | Within and after a meal |
| Peptide YY (PYY) | Ileum and colon | Promotes satiety after eating | Hours |
| Insulin | Pancreatic beta cells | Central satiety signal (distinct from its metabolic role) | Hours |
| Leptin | Adipose tissue | Reduces hunger; tracks total fat stores | Days to weeks |
Leptin deserves special attention because it is so often misdescribed. Adipocytes secrete it roughly in proportion to fat mass, so it functions as a long-term status report on energy stores. Rare congenital leptin deficiency causes extreme hyperphagia from infancy and responds dramatically to leptin replacement — one of the most striking results in the field. But common obesity is not a leptin deficiency; leptin levels are typically high, and the brain responds to them poorly, a state described as leptin resistance. Giving leptin to people with common obesity does not produce meaningful weight loss. Anyone selling a "leptin booster" is selling you a signal your body already has plenty of.
Why the body defends its weight
Here is the finding that reorganizes how this topic should be taught: the defense is asymmetric. The body resists weight loss far more vigorously than it resists weight gain — sensible for a species whose ancestors faced famine more often than a food court.
After weight loss, several things happen at once and they do not quickly reverse. Leptin falls, in a drop disproportionate to the fat lost. Ghrelin rises. Subjective hunger increases. Total energy expenditure falls by more than the smaller body size alone predicts — a phenomenon called adaptive thermogenesis or metabolic adaptation, on the order of a few hundred kilocalories per day in some studies. A well-known trial that followed people for a year after a weight-loss program found that appetite hormones and hunger ratings were still shifted toward eating a full twelve months later. Follow-up of participants from a televised extreme weight-loss competition found suppressed resting metabolic rate persisting for years, although that was a very small and unusual sample and the magnitude of long-term adaptation remains actively debated.
Weight is also substantially heritable. Twin and adoption studies place the heritability of BMI in the range of roughly 40–70 percent, and genome-wide studies have identified more than a thousand contributing variants, each with a small effect. The strongest common variant, in the FTO gene, is associated with only about a kilogram or so of body weight per risk allele. Genetics strongly influences how a person responds to an environment; it does not lock in an outcome. And the environment changed fast: the human genome did not shift meaningfully in fifty years, but portion sizes, food availability, energy density, and the amount of movement built into daily life all did.
- Hunger (physiological), appetite (psychological), satiation (ends a meal), and satiety (delays the next) are distinct.
- Ghrelin from the stomach drives eating; CCK, GLP-1, PYY, insulin, and leptin restrain it, via the hypothalamic melanocortin pathway.
- Leptin reports fat stores; common obesity involves leptin resistance, and leptin treatment does not help it.
- Weight is actively defended, and asymmetrically — loss triggers rising hunger and falling expenditure that persist for a year or more.
Section 5Weight management

What the strong evidence supports
Start with a frame that the evidence actually supports: health behaviors improve health whether or not weight changes. Cardiorespiratory fitness, blood pressure, insulin sensitivity, lipids, sleep, and mood all respond to regular activity and to eating patterns rich in vegetables, fruit, legumes, whole grains, nuts, and fish, independent of the number on the scale. That is not a consolation prize; it is a large and consistent body of evidence, and it means "no weight change" is not the same as "no benefit."
When weight change is a clinically appropriate goal, modest is meaningful. Losses in the range of 5–10 percent of body weight improve blood pressure, blood glucose, triglycerides, and hepatic fat. The clearest demonstration remains the Diabetes Prevention Program, in which an intensive lifestyle program targeting about 7 percent weight loss plus 150 minutes per week of moderate activity reduced progression from prediabetes to type 2 diabetes by 58 percent over roughly three years — substantially better than the medication comparison arm at 31 percent. That is strong evidence from a large randomized trial with long follow-up. Honesty requires the other side too: a later large trial of intensive lifestyle intervention in adults who already had type 2 diabetes produced more weight loss and better fitness but did not reduce cardiovascular events over about a decade. Behaviors help; they are not guaranteed to change every hard outcome.
What about the diet wars? Here the evidence is remarkably settled and remarkably boring. Head-to-head randomized trials comparing macronutrient patterns — low-fat versus low-carbohydrate, and four different fat/protein/carbohydrate combinations — have repeatedly found no meaningful difference in average weight change at one to two years. Within every arm of those trials, the spread between individuals was enormous while the difference between diets was trivial. The conclusion drawn by the investigators themselves: adherence, not composition, is the active ingredient. The best eating pattern for a given person is the nutritionally adequate one they can actually live with.
| Approach | Strength of evidence | What it does |
|---|---|---|
| Comprehensive behavioral programs (14+ sessions in 6 months) | Strong — systematic reviews, national screening recommendations | Modest sustained loss and improved cardiometabolic markers |
| Self-monitoring of intake, activity, and weight | Strong — consistent across trials | Most reliable single behavioral predictor of success |
| Regular physical activity (150–300 min/wk moderate plus 2 d/wk resistance) | Strong for health; strong for maintenance, modest for initial loss | Preserves lean mass; best predictor of keeping weight off |
| Higher protein and higher fiber intakes for satiety | Moderate | Improves fullness per calorie; helps adherence |
| Lower energy density (more water- and fiber-rich foods) | Moderate | Allows satisfying volume at lower energy intake |
| Specific macronutrient ratios (low-carb, low-fat, etc.) | Weak for superiority — repeatedly null head-to-head | Works only insofar as a person can sustain it |
| Meal timing, "metabolism-boosting" foods, detoxes, cleanses | Weak to none | Effects, where present, are small and largely explained by reduced intake |
Why fad diets fail — five reasons, none of them "you"
First, the early results are borrowed. Any sharp restriction depletes glycogen, and each gram of stored glycogen holds roughly three grams of water. Several pounds can disappear in the first week that are water, not fat — and they return just as fast. Diets that cut carbohydrate hardest produce the most dramatic first week and thereby earn undeserved credibility.
Second, restriction is a resource with a budget. Rules that eliminate whole food groups, forbid eating after a certain hour, or require unusual foods demand ongoing vigilance. Adherence declines predictably in every long trial regardless of which diet is assigned. A plan followed for six weeks and abandoned does not outperform a modest plan followed for six years.
Third, biology pushes back — the mechanisms from Section 4. Hunger hormones shift, expenditure falls more than predicted, and both effects persist. This is a physiological response, not a character flaw, and it is the single most important thing to understand about why maintenance is harder than loss.
Fourth, most fads have no maintenance phase. They describe an ending but not an after. Since the body's defense of lost weight persists for a year or more, "what happens next" is arguably the more important half of the plan, and it is usually the missing half.
Fifth, the failure is engineered to look personal. When the regain comes — and in most long-term follow-up studies the average participant regains the majority of lost weight within three to five years — the framing is that the person lacked discipline. The evidence says otherwise. Long-term maintainers do exist, roughly one in five people who lose a meaningful amount keeps at least ten percent off for a year or more, and registry data on them consistently show high physical activity (often close to an hour a day), regular self-weighing, a consistent eating pattern across weekdays and weekends, and eating breakfast. Those are observational associations, so they describe what maintainers do rather than proving what causes maintenance — but the pattern is stable across studies.
Two cautions to carry forward. Repeated cycles of loss and regain, and restrictive dieting in adolescence, are associated with disordered eating patterns and, paradoxically, with greater long-term weight gain — another reason extreme approaches are a poor bet. And medical treatments for obesity, including pharmacotherapy and metabolic surgery, are real, effective, and appropriate for some people; they belong in a conversation with a qualified clinician who knows the person's full history. Nothing in this chapter is individualized medical or dietary advice, and no doses or drug choices appear here for exactly that reason.
- Adherence beats composition — randomized head-to-head trials find no meaningful difference between macronutrient patterns at 1–2 years.
- 5–10% weight loss meaningfully improves cardiometabolic markers; the DPP showed a 58% reduction in progression to type 2 diabetes.
- Strongest behavioral evidence: comprehensive multi-session programs, self-monitoring, and regular physical activity, which best predicts maintenance.
- Fad diets fail because early loss is water, restriction is unsustainable, biology defends lost weight, and there is no maintenance plan — not because of personal weakness.
The chapter in one breath
- Food energy comes from four sources only: carbohydrate 4, protein 4, fat 9, alcohol 7 kcal/g (fiber ~2); 1 kcal = 4.184 kJ.
- Energy balance compares intake with expenditure over time, and the two sides adjust to each other — which is why simple arithmetic overpredicts long-term weight loss.
- Energy has an EER, not an RDA, and requirements shift with age, sex, body size, activity, pregnancy, and lactation.
- Expenditure = basal metabolism (~60–75%) + thermic effect of food (~10%) + activity (~15–30%); fat-free mass drives the first, and NEAT makes the third the most variable.
- BMI (kg/m²) screens populations but misclassifies individuals; waist circumference and waist-to-height ratio add the fat-distribution information BMI cannot see.
- Eating is governed by a hormonal loop — ghrelin up, leptin, GLP-1, PYY, CCK, insulin down — integrated in the hypothalamic melanocortin pathway.
- The body defends weight asymmetrically: after loss, hunger rises and expenditure falls beyond prediction, and both persist for a year or more.
- What works is sustained, supported behavior change, not a particular macronutrient ratio; fad diets fail for physiological and structural reasons, and describing a body or a food as good or bad has never once been part of the evidence.
ReferenceWords worth knowing
A quick reference for the terms in this chapter — skim it now, or circle back whenever a word trips you up.
- Adaptive thermogenesis
- The change in energy expenditure beyond what body-size change predicts, seen after weight loss or overfeeding; also called metabolic adaptation.
- Atwater factors
- The average physiological energy yields of the energy-supplying nutrients — 4, 4, 9, and 7 kcal/g for carbohydrate, protein, fat, and alcohol.
- Basal metabolic rate (BMR)
- Energy expended at complete rest under strict standardized conditions; the largest single component of total energy expenditure.
- Body composition
- The proportions of fat mass and fat-free mass (muscle, bone, organs, water) that make up body weight.
- Body mass index (BMI)
- Weight in kilograms divided by height in meters squared; a population screening index, not a measure of body fat.
- Doubly labeled water
- A stable-isotope method that measures total energy expenditure in free-living people over one to two weeks; the field's gold standard.
- Energy balance
- The relationship over time between energy taken in from food and drink and energy expended; may be positive, negative, or in equilibrium.
- Energy density
- Energy per gram of food; lowering it (more water and fiber) permits larger, more satisfying portions at the same energy intake.
- Estimated Energy Requirement (EER)
- The DRI value for energy: the average intake predicted to maintain balance in a healthy person of a given age, sex, size, and activity level.
- Fat-free mass
- All body mass other than stored fat; the strongest single predictor of basal metabolic rate.
- Ghrelin
- A stomach-derived hormone that stimulates hunger; it rises before meals and falls afterward.
- Indirect calorimetry
- Estimating energy expenditure from oxygen consumed and carbon dioxide produced; the practical clinical method for measuring resting metabolic rate.
- Kilocalorie (kcal)
- The energy to raise 1 kg of water by 1 °C; what food labels call a "Calorie." 1 kcal = 4.184 kJ.
- Leptin
- A hormone released by adipose tissue in proportion to fat mass that signals long-term energy stores to the brain and reduces hunger.
- Melanocortin pathway
- The hypothalamic circuit, involving POMC neurons and the MC4R receptor, through which satiety signals suppress food intake.
- Non-exercise activity thermogenesis (NEAT)
- Energy spent on all movement that is not deliberate exercise — posture, fidgeting, walking, occupational activity.
- Resting metabolic rate (RMR)
- Energy expended at rest under slightly less strict conditions than BMR; typically 5–10 percent higher than BMR.
- Satiation
- The set of signals that bring an episode of eating to an end and determine meal size.
- Satiety
- The feeling of fullness persisting after a meal that suppresses further eating and determines the interval to the next meal.
- Thermic effect of food (TEF)
- The energy cost of digesting, absorbing, and processing nutrients; roughly 10 percent of intake on a mixed diet.
- Visceral adipose tissue
- Fat stored around the abdominal organs; more strongly associated with cardiometabolic risk than subcutaneous fat.
- Waist circumference
- A tape measurement at the level of the top of the iliac crest used to estimate central adiposity and its associated risk.