Nutrition Through the Lifespan
Nutrient needs are not a fixed target you hit once and coast on — they move underneath you your whole life. A body that is building a second body, a body doubling its birth weight in six months, a body adding half its adult skeleton in four years, and a body defending muscle at eighty are all solving different problems with the same set of nutrients. This chapter walks that arc: pregnancy, lactation and infancy, childhood, adolescence, and older adulthood. In each stage the physiology tells you which nutrients get tight, and the tight nutrients tell you what a reasonable eating pattern looks like. Throughout, the emphasis is on what the evidence actually supports — and on describing bodies and foods without moralizing about either.
By the end of this chapter you can
- Explain why gestational weight gain recommendations differ by pre-pregnancy BMI, and what the added weight is physically made of.
- State the folate and iron recommendations in pregnancy with units and population, and explain the timing problem that makes preconception folate matter.
- List the food-safety and substance exposures advised against in pregnancy and give the reason behind each.
- Describe the composition of human milk, the nutrients that need attention in infancy, and how commercial infant formula is designed and safely prepared.
- Identify developmental readiness for complementary foods and summarize current evidence on introducing common allergens.
- Explain why appetite falls and fluctuates in toddlerhood, and apply a division of responsibility approach to feeding.
- Relate the adolescent growth spurt to peak calcium and iron needs, and describe weight-neutral ways to talk with teens about food and bodies.
- Explain why nutrient density becomes the central issue for older adults, and name the nutrients most often short.
Section 1Pregnancy

Energy, weight gain, and what the gain is made of
Pregnancy is among the most nutritionally demanding physiological states a human body undertakes, and yet the energy cost is smaller than most people expect. In the United States, the estimated additional energy need is essentially zero in the first trimester, roughly +340 kcal/day in the second, and roughly +452 kcal/day in the third. That is a snack and a half, not a second dinner. The old phrase "eating for two" overstates the calories badly while understating the part that actually changes: the demand for specific nutrients climbs much faster than the demand for energy, which is exactly why nutrient density matters more here than volume.
Weight gain in pregnancy is not incidental — it is the physical substrate of the pregnancy. Only a minority of it is the fetus. The rest is placenta, amniotic fluid, an enlarged uterus and breast tissue, an expanded blood volume, extracellular fluid, and maternal fat stores laid down to support lactation. Because the healthiest range of gain differs by where a person started, recommendations are indexed to pre-pregnancy BMI. These ranges come from observational data linking gain to outcomes such as preterm birth, birth weight, and cesarean delivery; they are population-level guidance for a clinician to individualize, not a moral scorecard, and both under-gain and over-gain carry risk.
| Pre-pregnancy BMI | Recommended total gain (singleton) | Approximate weekly gain, 2nd & 3rd trimester |
|---|---|---|
| Under 18.5 | 28–40 lb (12.5–18 kg) | ~1 lb (0.51 kg) |
| 18.5–24.9 | 25–35 lb (11.5–16 kg) | ~1 lb (0.42 kg) |
| 25.0–29.9 | 15–25 lb (7–11.5 kg) | ~0.6 lb (0.28 kg) |
| 30.0 and above | 11–20 lb (5–9 kg) | ~0.5 lb (0.22 kg) |
Protein needs rise from the general adult RDA of 0.8 g/kg/day to about 1.1 g/kg/day in pregnancy — an increase of roughly 25 g/day, which is comfortably met by most ordinary eating patterns, including well-planned vegetarian and vegan ones.
Folate and iron: the two that get tight
Two nutrients dominate prenatal counseling because both have large demand increases and real consequences when short. Folate is required for DNA synthesis and cell division, so it is under maximum strain wherever cells are dividing fastest. Its most famous role is closure of the neural tube, which happens by about 28 days after conception — frequently before a person knows they are pregnant. That timing is the whole argument for preconception intake. The evidence here is unusually strong: randomized controlled trials in the late 1980s and early 1990s showed that periconceptional folic acid substantially reduces the recurrence and occurrence of neural tube defects such as spina bifida and anencephaly, and mandatory folic acid fortification of enriched grains followed in many countries.
Note the two forms. Folate is the naturally occurring form in leafy greens, legumes, citrus, and liver; folic acid is the synthetic form used in supplements and fortification, and it is more efficiently absorbed. Recommendations are stated in dietary folate equivalents (DFE) to reconcile the two. The RDA is 400 µg DFE/day for non-pregnant adults, 600 µg DFE/day in pregnancy, and 500 µg DFE/day during lactation; on top of that, public health guidance is that anyone who could become pregnant get 400 µg/day of folic acid from fortified food or a supplement, in addition to food folate. The Tolerable Upper Intake Level of 1,000 µg/day applies to synthetic folic acid only, not to folate from food — the concern is that high folic acid can correct the anemia of vitamin B12 deficiency while the neurological damage quietly continues.
Iron is the second pressure point. Plasma volume expands by roughly 50% during pregnancy while red cell mass rises by a smaller proportion, which mathematically drops hemoglobin concentration — the normal, expected physiologic hemodilution of pregnancy. This is a dilution effect, not by itself a deficiency, though true iron deficiency anemia is also common and is associated with preterm birth and low birth weight. The iron RDA rises from 18 mg/day for non-pregnant women aged 19–50 (and 8 mg/day for adult men and postmenopausal women) to 27 mg/day in pregnancy — a jump few eating patterns close without a supplement, which is why prenatal vitamins routinely carry iron. Heme iron from meat, poultry, and fish is absorbed severalfold better than non-heme iron from plants and supplements; vitamin C eaten in the same meal meaningfully improves non-heme absorption, while the tannins in tea and coffee and the phytates in whole grains and legumes reduce it.
| Nutrient | Non-pregnant adult female (19–50) | Pregnancy | Lactation | Why it changes |
|---|---|---|---|---|
| Folate | 400 µg DFE | 600 µg DFE | 500 µg DFE | Rapid cell division; neural tube closure |
| Iron | 18 mg | 27 mg | 9 mg | Expanded red cell mass, placenta, fetal stores |
| Iodine | 150 µg | 220 µg | 290 µg | Fetal thyroid hormone and brain development |
| Choline (AI) | 425 mg | 450 mg | 550 mg | Membrane phospholipids, neurodevelopment |
| Calcium | 1,000 mg | 1,000 mg — unchanged | 1,000 mg | Absorption efficiency roughly doubles instead |
The calcium row surprises people. Pregnancy does not raise the calcium RDA for adults, because intestinal calcium absorption up-regulates sharply on its own. (For pregnant adolescents aged 14–18, calcium stays at the higher adolescent value of 1,300 mg/day because they are still building their own skeleton.)
What to avoid, and why
Avoidance lists circulate widely and are often longer than the evidence justifies, so it helps to know the actual mechanism behind each item. Three categories account for nearly all of it: teratogens, foodborne pathogens, and bioaccumulated toxicants.
| Avoid or limit | Mechanism | Strength of evidence |
|---|---|---|
| Alcohol | Teratogen crossing the placenta freely; causes fetal alcohol spectrum disorders | Strong — no threshold established as safe |
| High-mercury fish (shark, swordfish, king mackerel, tilefish, bigeye tuna) | Methylmercury bioaccumulates and is neurotoxic to the developing brain | Strong |
| Unpasteurized milk, soft cheeses from raw milk, deli meats, smoked seafood, raw sprouts | Listeria monocytogenes; pregnancy raises susceptibility many-fold and it crosses the placenta | Strong |
| Raw or undercooked eggs, meat, shellfish | Salmonella, Toxoplasma, Campylobacter | Strong |
| High-dose preformed vitamin A (retinol supplements, retinoid medications, very frequent liver) | Teratogenic above the UL of 3,000 µg RAE/day preformed vitamin A; beta-carotene is not implicated | Strong |
| Caffeine above ~200 mg/day (about one 12 oz coffee) | Crosses the placenta; slower fetal clearance | Moderate — observational, confounded, guidance is precautionary |
Notice the flip side of the fish advice: most fish are encouraged in pregnancy, not discouraged. Low-mercury choices such as salmon, sardines, tilapia, cod, and canned light tuna supply omega-3 fatty acids including DHA, and the balance of evidence favors eating them. Guidance in the United States suggests roughly 8–12 oz per week of low-mercury seafood. Evidence that supplemental DHA improves child neurodevelopmental outcomes is mixed and should be described as preliminary; evidence that it modestly reduces early preterm birth is somewhat stronger but still not settled.
- Added energy is modest (0 / +340 / +452 kcal/day by trimester); added nutrient needs are proportionally much larger.
- Gestational weight gain ranges are indexed to pre-pregnancy BMI; the gain is mostly placenta, fluid, blood volume, and tissue — not just fetus.
- Folate 600 µg DFE/day in pregnancy plus 400 µg/day folic acid preconception; iron 27 mg/day versus 18 mg/day non-pregnant.
- Avoidance lists reduce to three mechanisms: teratogens, foodborne pathogens, and bioaccumulated toxicants — and most seafood is encouraged, not avoided.
Section 2Lactation and infancy
Lactation: an energy cost on the order of late pregnancy
Milk production is energetically expensive — broadly comparable to the third trimester rather than dramatically above it. A person establishing full milk supply makes roughly 750–800 mL/day in the first six months, exporting on the order of 500 kcal/day as milk. The estimated additional energy need is about +330 kcal/day in the first six months — that gross cost minus roughly 170 kcal/day expected from mobilizing fat stored during pregnancy — and about +400 kcal/day in the second six months, when no such offset is assumed. Set those beside the +452 kcal/day of the third trimester and the honest summary is that late pregnancy and lactation sit in the same range. Several micronutrient needs, however, genuinely do peak here rather than in pregnancy: vitamin A rises to 1,300 µg RAE/day and iodine to 290 µg/day. One goes down sharply — iron falls to 9 mg/day for lactating adults, lower than the 18 mg/day baseline, because menstruation is typically suppressed. Fluid needs rise with milk output; thirst is a reasonable guide.
Human milk runs about 65–70 kcal per 100 mL, with roughly 7 g lactose, 3.5–4.5 g fat, and about 1 g protein per 100 mL. Because fat yields 9 kcal/g while carbohydrate and protein each yield 4 kcal/g (and alcohol yields 7 kcal/g), that small fat fraction supplies close to half the total energy — infancy is the one life stage where a high-fat diet is unambiguously the physiologically correct one. The first milk, colostrum, is low in volume but concentrated in protein and secretory IgA. Human milk also contains human milk oligosaccharides (HMOs), which the infant cannot digest at all; they exist to feed Bifidobacterium in the infant gut, an elegant case of a food component whose target is not the eater.
Breastfeeding is recommended exclusively for about the first six months, with continued breastfeeding alongside complementary foods through at least twelve months and beyond as long as mutually desired. The observational evidence for reduced infant gastrointestinal and respiratory infection is consistent and strong; claims about long-term IQ and chronic disease are weaker and heavily confounded by socioeconomic factors, and should be stated cautiously. Two supplements are standard practice in infancy: vitamin K given at birth to prevent vitamin K deficiency bleeding, and vitamin D 400 IU/day for breastfed and partially breastfed infants, because human milk is genuinely low in vitamin D regardless of how well the lactating parent eats.
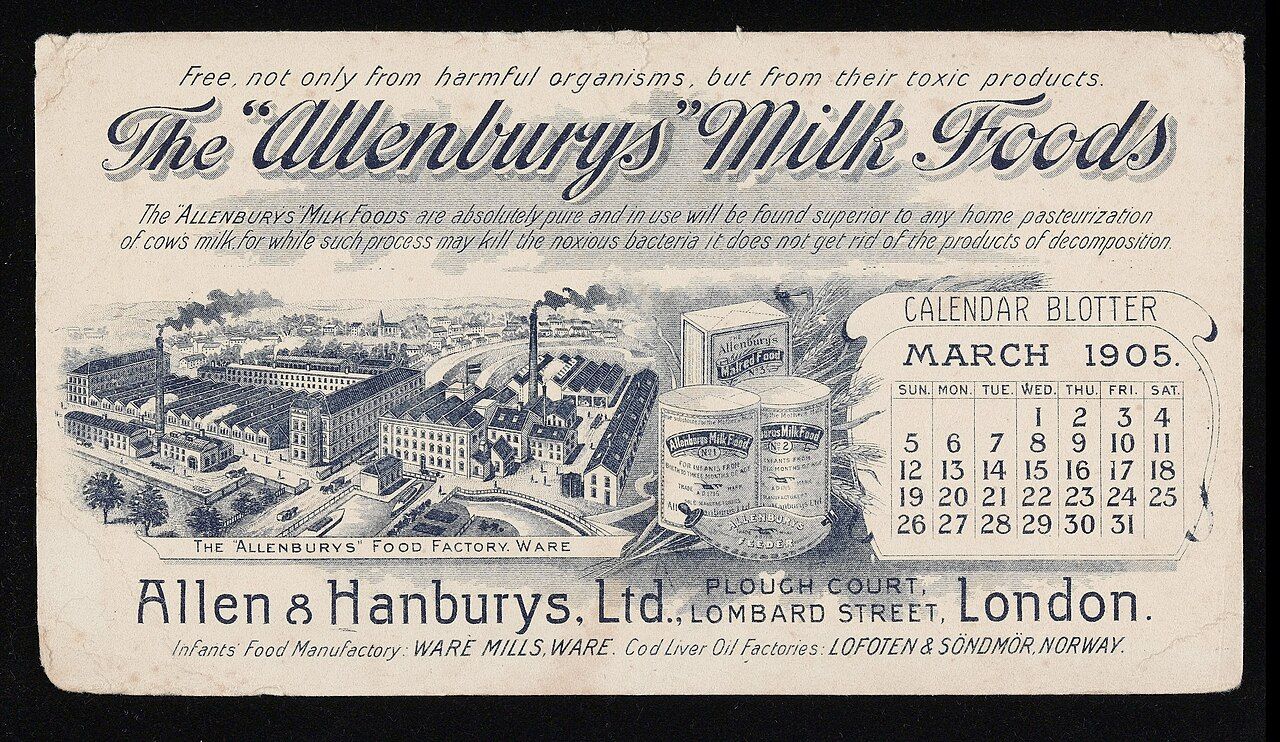
Formula, and feeding without judgment
Commercial infant formula is a regulated food designed to approximate human milk's nutrient profile. In the United States its composition is governed by the Infant Formula Act, and standard iron-fortified cow-milk-based formula is the appropriate default for infants who are not exclusively breastfed. Specialty formulas — soy-based, extensively hydrolyzed, amino-acid-based — exist for specific medical indications and are not upgrades for typical infants. Formula feeding is a safe, complete way to feed a baby, and framing it otherwise adds guilt without adding nutrition.
The safety issues in formula feeding are almost entirely about preparation, and they are serious ones. Formula must be mixed exactly to the label ratio. Over-diluting to stretch a can causes water intoxication and hyponatremia — an infant's kidneys cannot excrete a large free-water load — along with inadequate energy intake. Homemade formula recipes have caused hospitalizations for electrolyte disturbance and nutrient deficiency and should never be used. Powdered formula is not sterile, so preparation guidance for very young or medically fragile infants may call for hot water or ready-to-feed liquid.
| Feature | Human milk | Standard iron-fortified formula |
|---|---|---|
| Energy | ~65–70 kcal/100 mL | ~67 kcal/100 mL (20 kcal/oz) |
| Protein type | Whey-predominant; changes over lactation | Cow-milk protein, whey-adjusted |
| Iron | Low concentration but highly bioavailable | Fortified; lower bioavailability, higher amount |
| Vitamin D | Low — supplementation advised | Fortified to meet needs |
| Immune factors | Secretory IgA, lactoferrin, live cells, HMOs | Not replicated |
| Composition | Varies by feed, time of day, and infant age | Constant and predictable |
Introducing solids
Infants grow faster in the first year than they ever will again — birth weight roughly doubles by 4–6 months and triples by 12 months — and their energy needs per kilogram show it, starting near 100 kcal/kg/day and easing toward 80 kcal/kg/day by the first birthday, against roughly 30–35 kcal/kg/day for a typical adult. Milk alone stops covering this around six months, and the nutrient that runs out first is iron: a term infant is born with stores that last about 4–6 months. That is the physiological reason complementary foods begin when they do, and the reason iron-rich first foods are emphasized.
Readiness is developmental, not calendar-driven. Look for sitting with support and steady head control, the fading of the extrusion reflex (the automatic tongue-thrust that pushes a spoon back out), and active interest in reaching for food. Offer single new foods a few days apart, with textures that progress as oral motor skill does. Several hard limits belong in every infant-feeding discussion: no honey before 12 months (spores of Clostridium botulinum can germinate in the immature gut and cause infant botulism), no cow's milk as a main drink before 12 months (too little iron, too high a renal solute load, and occult gastrointestinal blood loss), no juice in the first year, and vigilance about choking hazards such as whole grapes, nuts, popcorn, and coin-shaped hot dog slices.
The allergen guidance has genuinely reversed, and this is worth knowing precisely. For years, delaying peanut, egg, and other allergens was standard advice. The LEAP randomized trial, published in 2015, found that early introduction of peanut between roughly 4 and 11 months substantially reduced peanut allergy in high-risk infants. This is strong, randomized evidence, and guidelines now recommend introducing common allergens in the first year rather than delaying them, with medical guidance first for infants with severe eczema or an existing food allergy.
- Lactation adds about +330 kcal/day (0–6 mo) and +400 kcal/day (7–12 mo) — comparable to the third trimester's +452, not far above it; iron needs drop to 9 mg/day while vitamin A and iodine reach their lifespan peaks.
- Fat supplies roughly half of human milk's energy at 9 kcal/g; HMOs feed the infant's gut bacteria, not the infant.
- Standard supplements in infancy: vitamin K at birth and vitamin D 400 IU/day for breastfed infants; formula is a safe, complete alternative when prepared exactly as labeled.
- Complementary foods start around 6 months when iron stores run down; introduce common allergens early rather than delaying, and never give honey before 12 months.
Section 3Childhood
Growth slows — and so does appetite
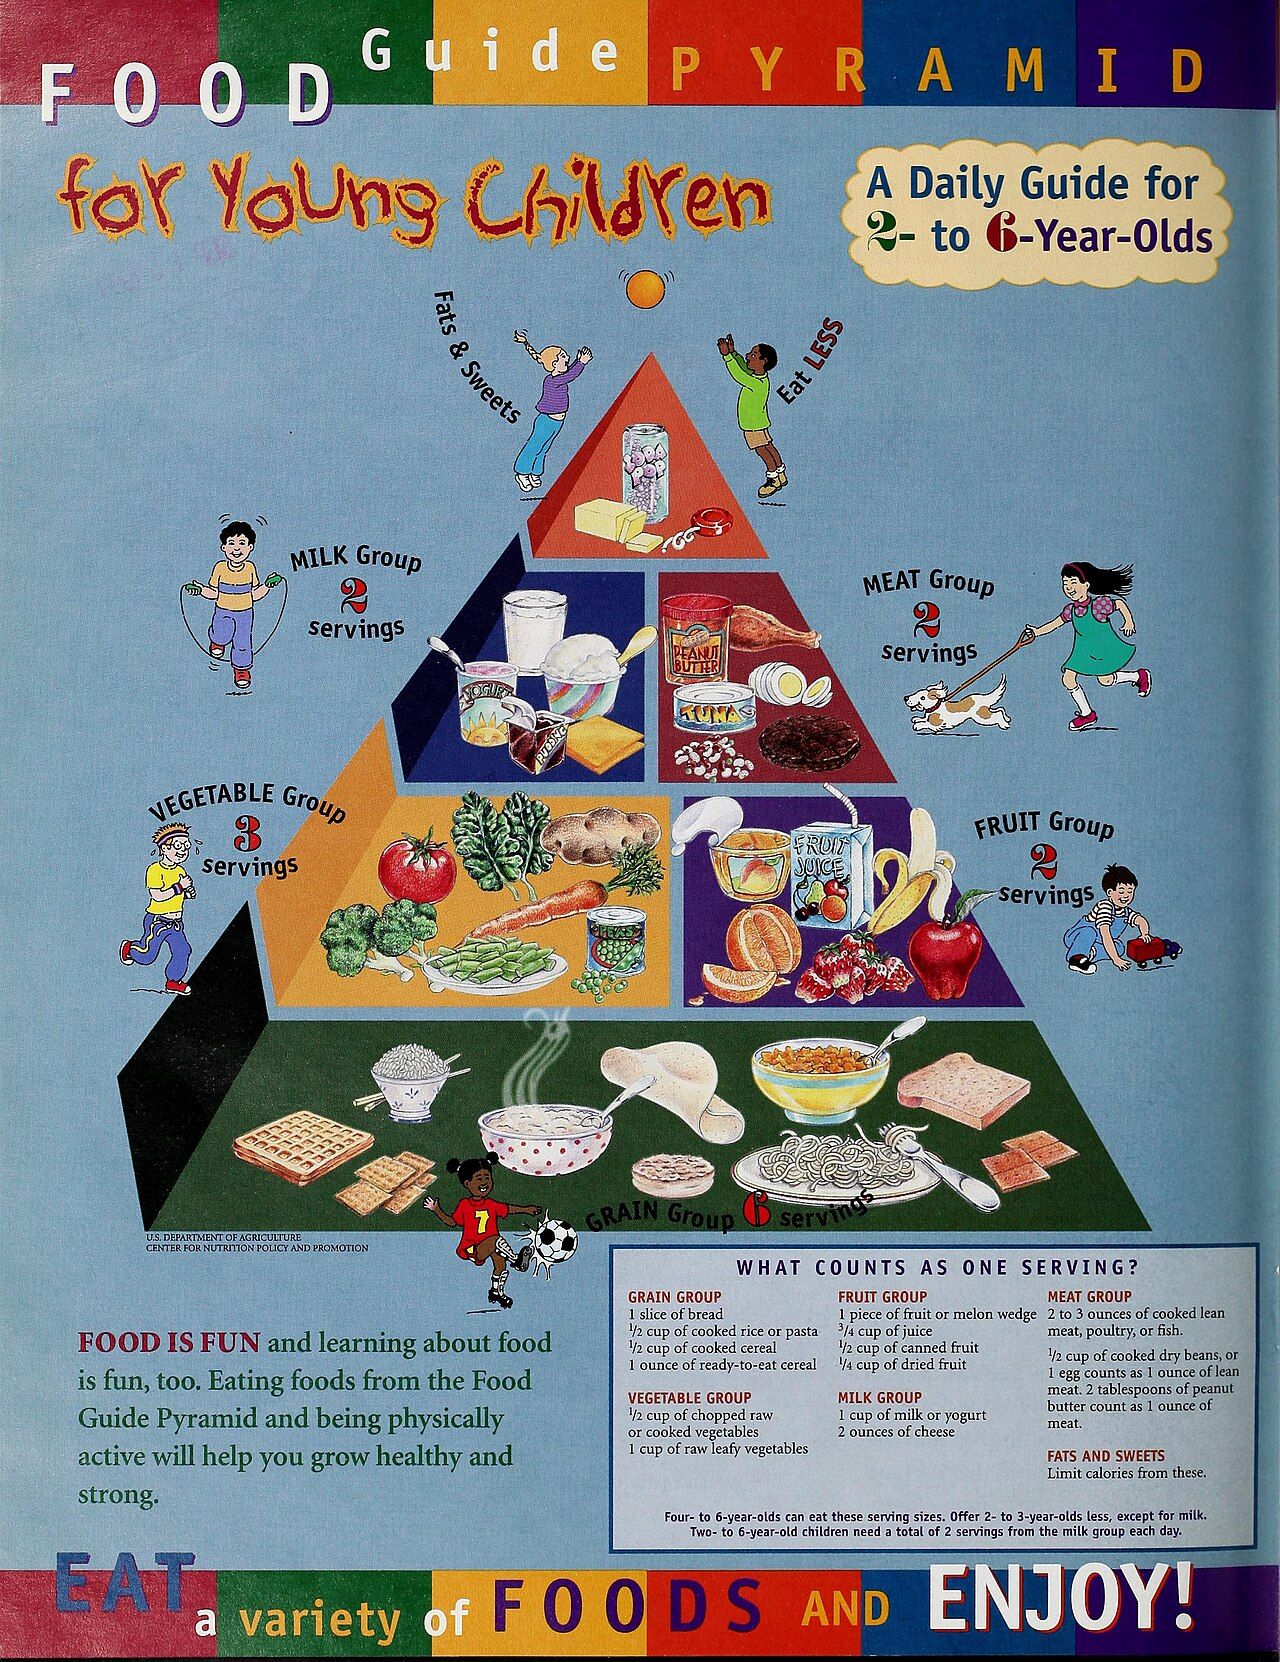
After the first birthday, growth decelerates dramatically. A toddler who gained roughly 7 kg in year one gains only about 2–3 kg per year and grows roughly 7–8 cm per year in the preschool years, easing to about 5–6 cm per year through the school years. Appetite tracks growth, so it falls too. This entirely normal drop is sometimes called the physiologic anorexia of toddlerhood, and it is the source of an enormous amount of unnecessary worry: a child who ate everything at eleven months and picks at dinner at eighteen months is usually not sick, not stubborn, and not underfed — just growing more slowly.
Intake in early childhood is also wildly erratic day to day while being remarkably stable across a week. A toddler may eat almost nothing at dinner and then eat enormously at breakfast. Judge intake over five to seven days, not one meal. The more reliable objective signal is the growth chart: WHO charts are used from birth to two years and CDC charts from two to twenty years, and what matters is whether a child is tracking along their own established curve, not which percentile that curve happens to be. A child steady at the 15th percentile is doing fine; a child crossing downward from the 75th to the 25th warrants a look.
| Nutrient | Ages 1–3 | Ages 4–8 | Ages 9–13 | Note |
|---|---|---|---|---|
| Protein (RDA) | 1.05 g/kg | 0.95 g/kg | 0.95 g/kg | Higher per kg than the adult 0.8 g/kg |
| Calcium (RDA) | 700 mg | 1,000 mg | 1,300 mg | Rises steeply as bone accrual accelerates |
| Iron (RDA) | 7 mg | 10 mg | 8 mg | Toddlers are a peak-risk group for deficiency |
| Vitamin D (RDA) | 600 IU (15 µg) | 600 IU (15 µg) | 600 IU (15 µg) | Same from age 1 through 70 |
| Fiber (AI) | 19 g | 25 g | 26–31 g | Roughly 14 g per 1,000 kcal at every age |
Iron deficiency deserves a specific warning in this age group. When cow's milk becomes a child's dominant beverage, it displaces iron-rich foods, contributes essentially no iron itself, and can cause small-volume gastrointestinal blood loss — a combination that produces microcytic hypochromic anemia in an otherwise well-fed-looking toddler. Iron deficiency in early childhood is associated with impaired cognitive and motor development, and some of that appears not to fully reverse with later repletion, which is why it is screened for rather than waited on.
Building habits without turning meals into a battle
Food neophobia — reluctance to try unfamiliar foods — emerges around age two and peaks between roughly two and six. It is developmentally normal and probably protective in a species whose toddlers become mobile before they become sensible. It also fades with plain repeated exposure: acceptance often takes eight to fifteen or more neutral encounters with a food, which means "she doesn't like broccoli" after three tries is a premature conclusion.
What consistently backfires is pressure. Experimental and longitudinal research on child feeding consistently finds that pressuring a child to eat a food reduces liking for it, and that using a disliked food to earn a preferred one ("two more bites of peas and you get dessert") lowers the value of the peas while raising the value of dessert — the precise opposite of the intent. Heavy restriction of specific foods tends to increase a child's interest in and consumption of those foods when they become available. The practical alternative, widely taught as the division of responsibility, splits the job: caregivers decide what food is offered, when, and where; the child decides whether to eat and how much. This preserves the child's own hunger and fullness signals, which are the regulatory system you actually want to keep intact for the next eighty years.
- Growth and appetite both slow sharply after age one — the drop is normal, and intake should be judged over a week, not a meal.
- Track a child's own growth curve over time rather than a single percentile.
- Excess cow's milk displacing iron-rich foods is a leading cause of iron deficiency anemia in toddlers.
- Neophobia fades with repeated neutral exposure; pressure and food-as-reward reduce liking, while the division of responsibility preserves self-regulation.
Section 4Adolescence
The growth spurt is a construction project
Adolescence delivers the second-fastest growth of the lifespan. Teenagers add roughly 15–20% of their adult height and, more consequentially for nutrition, close to half of their adult skeletal mass during these years. Peak height velocity arrives around ages 11–12 in girls and 13–14 in boys, with growth of roughly 8–10 cm in the peak year. Lean mass, blood volume, and organ size all scale up alongside height. Energy needs during this window are highly individual — driven by growth stage and activity far more than by age — which makes fixed calorie targets unhelpful and appetite a more reasonable guide than arithmetic.
The bone story is the one worth being emphatic about, because it has a deadline. Roughly 90% of peak bone mass is accrued by about age 18–20, with the peak itself reached in the mid-to-late twenties; after that, the skeleton is essentially in maintenance and slow decline. Calcium intake and weight-bearing physical activity during adolescence therefore influence fracture risk half a century later, and the window does not reopen. This is why the calcium RDA is 1,300 mg/day for ages 9–18 in both sexes — the highest of any life stage, higher than in pregnancy — paired with 600 IU (15 µg)/day of vitamin D. Surveys consistently find adolescent calcium intake falling short of that number, particularly in girls.
Iron needs rise in both sexes for different reasons, which is a useful teaching contrast. In males, expanding lean body mass and blood volume drive the increase and it recedes once growth completes; in females, menstrual losses begin and the elevated need persists through the reproductive years. Hence the split RDA at ages 14–18: 11 mg/day for males and 15 mg/day for females. Zinc, needed for growth and sexual maturation, similarly splits at 11 mg/day and 9 mg/day.
| Nutrient | Ages 9–13 (both) | Ages 14–18 male | Ages 14–18 female | Driver |
|---|---|---|---|---|
| Calcium | 1,300 mg | 1,300 mg | 1,300 mg | Peak bone mineral accrual |
| Vitamin D | 600 IU (15 µg) | 600 IU (15 µg) | 600 IU (15 µg) | Calcium absorption, bone mineralization |
| Iron | 8 mg | 11 mg | 15 mg | Lean mass and blood volume; menstrual loss |
| Zinc | 8 mg | 11 mg | 9 mg | Growth and sexual maturation |
| Protein | 0.95 g/kg | 0.85 g/kg | 0.85 g/kg | Rapid accrual of lean tissue |
Body image, and how not to make it worse
Adolescence is also when body dissatisfaction and disordered eating most often begin, which places anyone teaching nutrition to teens in a position of real influence — in either direction. The evidence on this is more consistent than people expect. Longitudinal research finds that weight-focused conversations, weight teasing, and weight-control encouragement from adults are associated with more disordered eating and no improvement in health behaviors. Conversations that focus on behaviors rather than bodies — eating regularly, eating enough, moving in ways you enjoy, sleeping — do not carry the same risk.
Two things follow practically. First, a weight-neutral vocabulary is not merely polite; it is the option better supported by the available outcome data, which is largely longitudinal and observational but unusually consistent in direction. Describe what nutrients do and what foods contain, and drop the language of "good" and "bad" foods, "guilt-free," "earning" dessert, and "cheat meals" — the moral framing is what carries the harm, and it does not improve intake. Second, know that this age group is the one where underfueling is a common and under-recognized problem. In physically active teens, low energy availability — not eating enough to cover both training and growth — is linked to menstrual disruption, impaired bone accrual, stress fractures, and poor recovery. The energy-availability link is well supported; the broader syndrome frameworks describing it are still evolving. Persistent restriction, rigid food rules, distress after eating, or loss of menstrual periods are signals to involve a qualified clinician, not to teach around.
- Adolescents add 15–20% of adult height and roughly half their adult skeletal mass; energy needs are individual, not formula-driven.
- Calcium 1,300 mg/day (ages 9–18) is the highest of any life stage; about 90% of peak bone mass is set by age 18–20.
- Iron RDA splits at 14–18: 11 mg/day male, 15 mg/day female — different physiology, same nutrient.
- Weight-focused talk and weight teasing predict disordered eating; behavior-focused, weight-neutral language is both kinder and better supported.
Section 5Older adults

Fewer calories, the same or more of everything else
The defining nutritional feature of later life is a divergence. Energy needs fall — lean mass declines, resting metabolic rate follows it down, and activity usually decreases — while requirements for most vitamins and minerals stay flat and several actually rise. Less food coming in, the same or more nutrients required from it. That squeeze is why nutrient density, the amount of nutrient delivered per calorie, becomes the organizing idea of this life stage rather than one concept among many.
Several DRIs change at 51 and again at 71, and the pattern is worth memorizing as a group rather than one at a time.
| Nutrient | Adults 19–50 | Ages 51–70 | Over 70 | Reason |
|---|---|---|---|---|
| Vitamin D | 600 IU (15 µg) | 600 IU (15 µg) | 800 IU (20 µg) | Reduced skin synthesis and sun exposure |
| Calcium | 1,000 mg | 1,000 mg men / 1,200 mg women | 1,200 mg both | Accelerated bone loss after menopause |
| Vitamin B6 | 1.3 mg | 1.7 mg men / 1.5 mg women | Same | Reduced efficiency of utilization |
| Vitamin B12 | 2.4 µg | 2.4 µg from fortified food or supplement | Same | Atrophic gastritis impairs food-bound B12 |
| Fiber (AI) | 38 g men / 25 g women | 30 g men / 21 g women | Same | Scales with lower energy intake |
| Water (AI, total) | 3.7 L men / 2.7 L women | Unchanged | Unchanged | Need is the same; thirst sensation is not |
The B12 row is the one that trips students, so read it carefully: the amount does not change, but the recommended source does. Roughly 10–30% of older adults develop atrophic gastritis, producing too little stomach acid and pepsin to free B12 from the protein it is bound to in food. Crystalline B12 in fortified cereals and supplements is not protein-bound and is absorbed normally, so the DRI explicitly advises adults over 50 to get most of their B12 from those sources. Untreated deficiency causes megaloblastic (macrocytic) anemia plus a neurological syndrome — paresthesias, gait disturbance, cognitive change — and the neurological damage can become permanent. This is also where the folic acid caution from Section 1 lands: high folic acid intake can normalize the blood count while the nerve damage advances unseen.
Muscle is the other headline. Sarcopenia, the age-related loss of muscle mass and function, begins subtly around age thirty and accelerates after sixty, and it is one of the strongest nutrition-related contributors to falls, fractures, and loss of independence. The protein RDA remains 0.8 g/kg/day at all adult ages, but multiple expert groups have argued this is too low for older adults and suggest roughly 1.0–1.2 g/kg/day. Be precise about the status of that number: it is expert consensus and mechanistic reasoning, not a revised DRI, and the trials are not uniformly positive. What is well established is that protein works far better in combination with resistance exercise than alone, and that spreading protein across meals rather than concentrating it at dinner is likely more effective.
Appetite, access, and the practical work
Appetite commonly declines with age — sometimes called the anorexia of aging — and the causes stack. Gastric emptying slows and satiety hormone signaling shifts, so fullness arrives sooner and lasts longer. Taste and smell acuity decline, flattening the reward of eating. Dentition problems, dry mouth, and dysphagia make eating effortful. Many common medications alter taste or cause nausea. And the non-physiological causes matter at least as much: eating alone after a spouse dies, depression, limited mobility for shopping and cooking, and food insecurity on a fixed income.
One clinical asymmetry is worth flagging plainly. In older adults, unintentional weight loss is a warning sign, not an achievement. It typically reflects loss of muscle along with fat and is associated with worse outcomes — falls, delayed healing, infection, mortality. Unexplained weight loss in an older adult belongs in front of a clinician rather than being congratulated.
The interventions that follow are unglamorous and effective: put protein in every meal rather than only dinner; use flavor generously — herbs, acid, aromatics — to compensate for dulled taste without leaning on salt; choose textures that match chewing and swallowing ability rather than abandoning whole food categories; offer smaller, more frequent meals when early satiety is the barrier; keep fluids visible and offered on a schedule since thirst is unreliable; pair fiber increases with fluid; and treat congregate meal programs, home-delivered meals, and grocery assistance as legitimate nutrition interventions. Eating with other people reliably increases intake, which makes company itself a nutritional variable.
- Energy needs fall while micronutrient needs hold or rise — making nutrient density the central concern of later life.
- Needs that increase: vitamin D 800 IU/day after 70, calcium 1,200 mg/day, vitamin B6; B12 stays at 2.4 µg but should come from fortified food or a supplement.
- Sarcopenia drives falls and lost independence; expert groups suggest 1.0–1.2 g/kg/day protein with resistance exercise, above the RDA of 0.8 g/kg/day — consensus, not a revised DRI.
- Appetite decline is multifactorial, thirst is unreliable, and unintentional weight loss is a red flag in older adults.
The chapter in one breath
- Pregnancy adds modest energy (0 / +340 / +452 kcal/day by trimester) but sharply higher nutrient needs; weight gain ranges are indexed to pre-pregnancy BMI and describe outcomes, not virtue.
- Folate (600 µg DFE/day in pregnancy, plus 400 µg/day folic acid preconception) protects neural tube closure, which happens by day 28 — often before a pregnancy is known.
- Iron rises to 27 mg/day in pregnancy against a plasma-volume expansion that also causes normal physiologic hemodilution; avoidance advice reduces to teratogens, pathogens, and bioaccumulated toxicants.
- Lactation carries an energy cost on the order of late pregnancy (+330 to +400 kcal/day, against roughly 500 kcal/day exported as milk); human milk gets about half its energy from fat at 9 kcal/g, and its HMOs feed the infant's gut bacteria rather than the infant.
- Infancy needs vitamin D supplementation while breastfeeding, iron-rich complementary foods from about six months, no honey before twelve months, and early rather than delayed allergen introduction.
- Childhood growth and appetite both slow; judge intake across a week and track the child's own growth curve, and remember that pressure and food-as-reward reduce liking while repeated neutral exposure builds it.
- Adolescence banks nearly all peak bone mass, making calcium 1,300 mg/day the highest of any life stage, and it is the point where weight-focused talk does measurable harm.
- Older adults need fewer calories but as many or more nutrients, so nutrient density rules — watch B12 source, vitamin D, calcium, protein against sarcopenia, and unreliable thirst and appetite.
ReferenceWords worth knowing
A quick reference for the terms in this chapter — skim it now, or circle back whenever a word trips you up.
- Anorexia of aging
- The multifactorial decline in appetite common in later life, driven by slower gastric emptying, altered satiety signaling, reduced taste and smell, dental and swallowing difficulty, medications, and social factors.
- Colostrum
- The first milk produced after birth — small in volume, high in protein and secretory IgA, and lower in fat and lactose than mature milk.
- Complementary foods
- Foods other than human milk or formula introduced around six months of age to complement, not replace, milk feeding.
- Dietary folate equivalents (DFE)
- The unit used to state folate recommendations, adjusting for the higher absorption of synthetic folic acid relative to naturally occurring food folate.
- Division of responsibility
- A feeding framework in which the caregiver decides what food is offered, when, and where, while the child decides whether to eat and how much.
- Exclusive breastfeeding
- Feeding an infant only human milk, with no other liquids or foods except prescribed supplements such as vitamin D; recommended for roughly the first six months.
- Extrusion reflex
- The infant tongue-thrust that automatically pushes solid material out of the mouth; its fading is one sign of readiness for complementary foods.
- Food neophobia
- Reluctance to try unfamiliar foods, emerging around age two and peaking between two and six; it typically fades with repeated neutral exposure.
- Gestational weight gain
- Total weight gained during pregnancy — comprising fetus, placenta, amniotic fluid, uterine and breast tissue, expanded blood and extracellular fluid, and maternal fat stores — with recommended ranges indexed to pre-pregnancy BMI.
- Heme iron
- Iron bound within hemoglobin and myoglobin in meat, poultry, and fish; absorbed severalfold more efficiently than non-heme iron and less affected by dietary inhibitors.
- Human milk oligosaccharides (HMOs)
- Complex carbohydrates in human milk that the infant cannot digest; they act as prebiotics selectively feeding Bifidobacterium in the infant gut.
- Neural tube defect
- A malformation such as spina bifida or anencephaly arising from incomplete closure of the neural tube by about day 28 after conception; risk is substantially reduced by periconceptional folic acid.
- Non-heme iron
- Iron from plant foods, eggs, fortified foods, and supplements; absorption is lower and is enhanced by vitamin C and inhibited by phytates, polyphenols, and calcium taken at the same meal.
- Nutrient density
- The amount of essential nutrients a food supplies relative to its energy content; the organizing principle when energy needs fall but nutrient needs do not.
- Peak bone mass
- The maximum bone mineral content an individual attains, roughly 90% of it accrued by age 18–20 and the peak reached in the mid-to-late twenties.
- Peak height velocity
- The point of fastest linear growth during the adolescent spurt, typically around ages 11–12 in girls and 13–14 in boys.
- Physiologic hemodilution of pregnancy
- The expected fall in hemoglobin concentration when plasma volume expands by roughly 50% while red cell mass rises proportionally less; a dilution effect distinct from true iron deficiency anemia.
- Sarcopenia
- Age-related loss of skeletal muscle mass and function, beginning in the fourth decade and accelerating after sixty; a major contributor to falls, fractures, and loss of independence.
- Teratogen
- An agent that causes structural or functional abnormalities in a developing embryo or fetus — alcohol, methylmercury, and high-dose preformed vitamin A are dietary-relevant examples.
- Weaning
- The gradual process of transitioning an infant from exclusive milk feeding to the family diet; a process spanning months, not a single event.